Example: Using the Request Browser to Display Grouped Entities
The following example displays the Application Health by Customer Visibility of an organization's applications and, specifically, allows the organization's analyst to track the applications that are red for customer-facing applications in Beijing, Bangalore, and Los Angeles:
-
From the menu bar, select Open > Application Portfolio > Analyze > Groups > Group Entities.
The Browse Entities page opens.
-
In the Entities area, click Application.
The Request Browser: APM - Application page opens.
-
In the Request Browser Tree Configuration section towards the bottom of the page, do the following:
-
In the Additional Column list, select or type Location.
The Column Values list is displayed to the right of the Additional Column field.
-
In the Column Values list, select Nanjing, Shanghai, and Ukraine and click OK.
-
-
In the Choose Fields to Group by in Request Browser Tree section, select Customer Visibility and Application Health from the Available Fields list. Click the right arrow to move them to the Selected Fields list.
Note: The order in which you list the fields in this section determines the results that are displayed.
-
In the Choose Columns for Request List section (above the Request Browser Tree Configuration section), select the fields of the application that are to be tracked from the Available Columns list: Title, Status, Business Owner, Active Users, Total Score, and Location. Click the right arrow to move them to the Selected Columns list.
-
Click Browse.
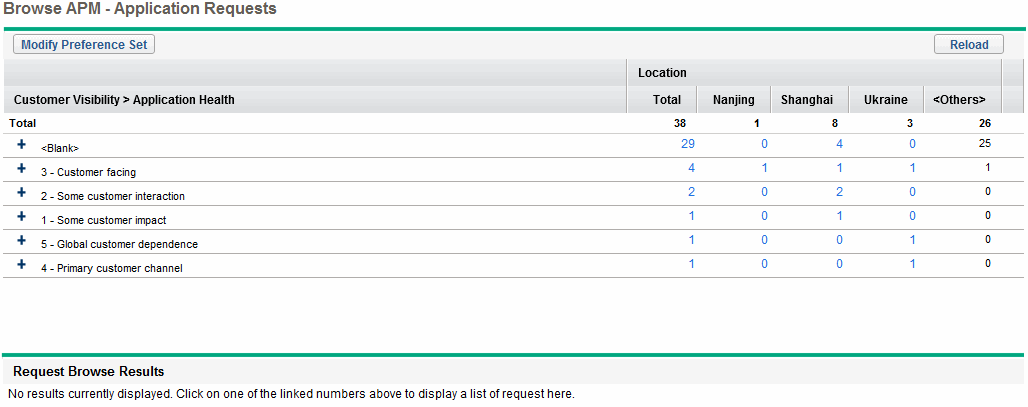
The Browse APM - Application Requests page opens.

-
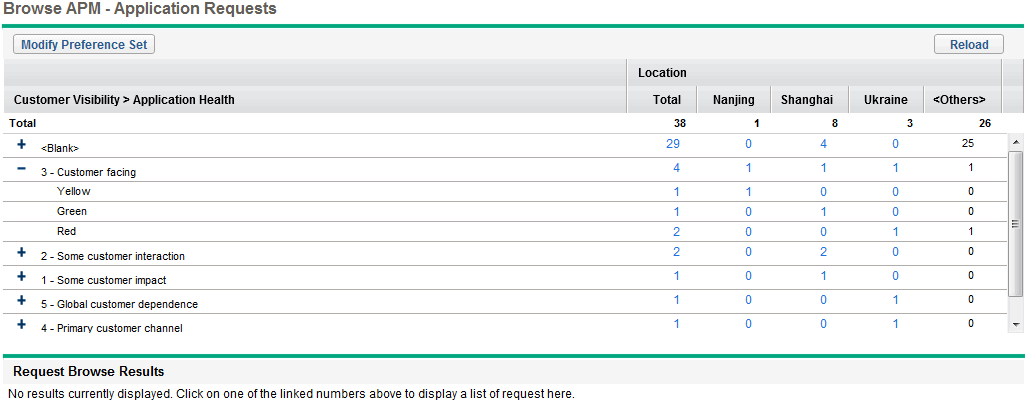
In the list of entities, expand the 3 - Customer facing group to show the totals by Application Health.
There are two applications that are customer-facing and whose health is red. There is one application of this type in Ukraine and no applications of this type in Nanjing and Shanghai.

-
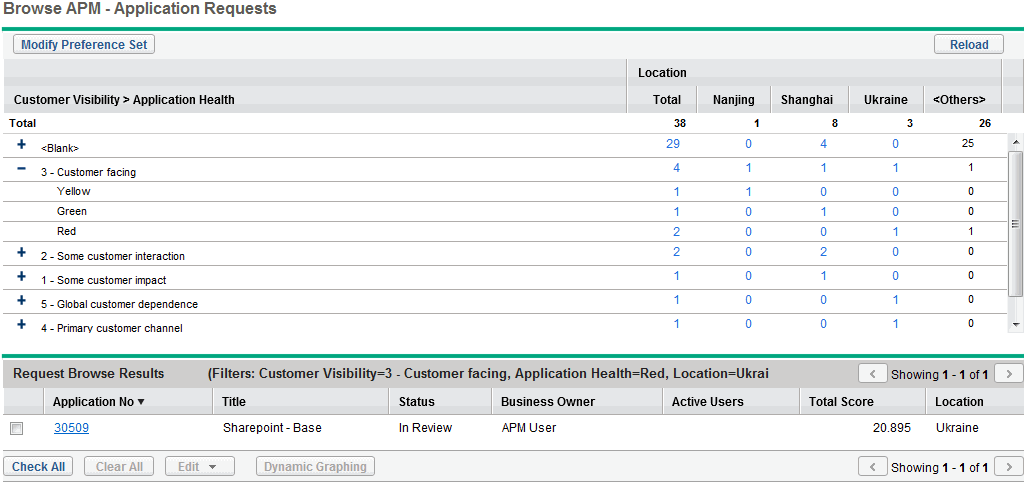
Click on the number 1 that represents the number of customer-facing applications located in Ukraine whose health is Red.
The application that belongs to this group is displayed in the Request Browse Results section at the bottom of the page.

Tip: You can use dynamic graphing to view the graphical relationships between the applications or processes listed in the Request Browse Results section. For instructions, see Dynamic graphing.
-
To save the results as a Microsoft Excel file, click Export to Excel.


