Analyze project costs
PPM provides useful interfaces for visualizing project cost data. The primary visualization tools are discussed in the following sections.
In this topic:
Project Cumulative Cost Metrics
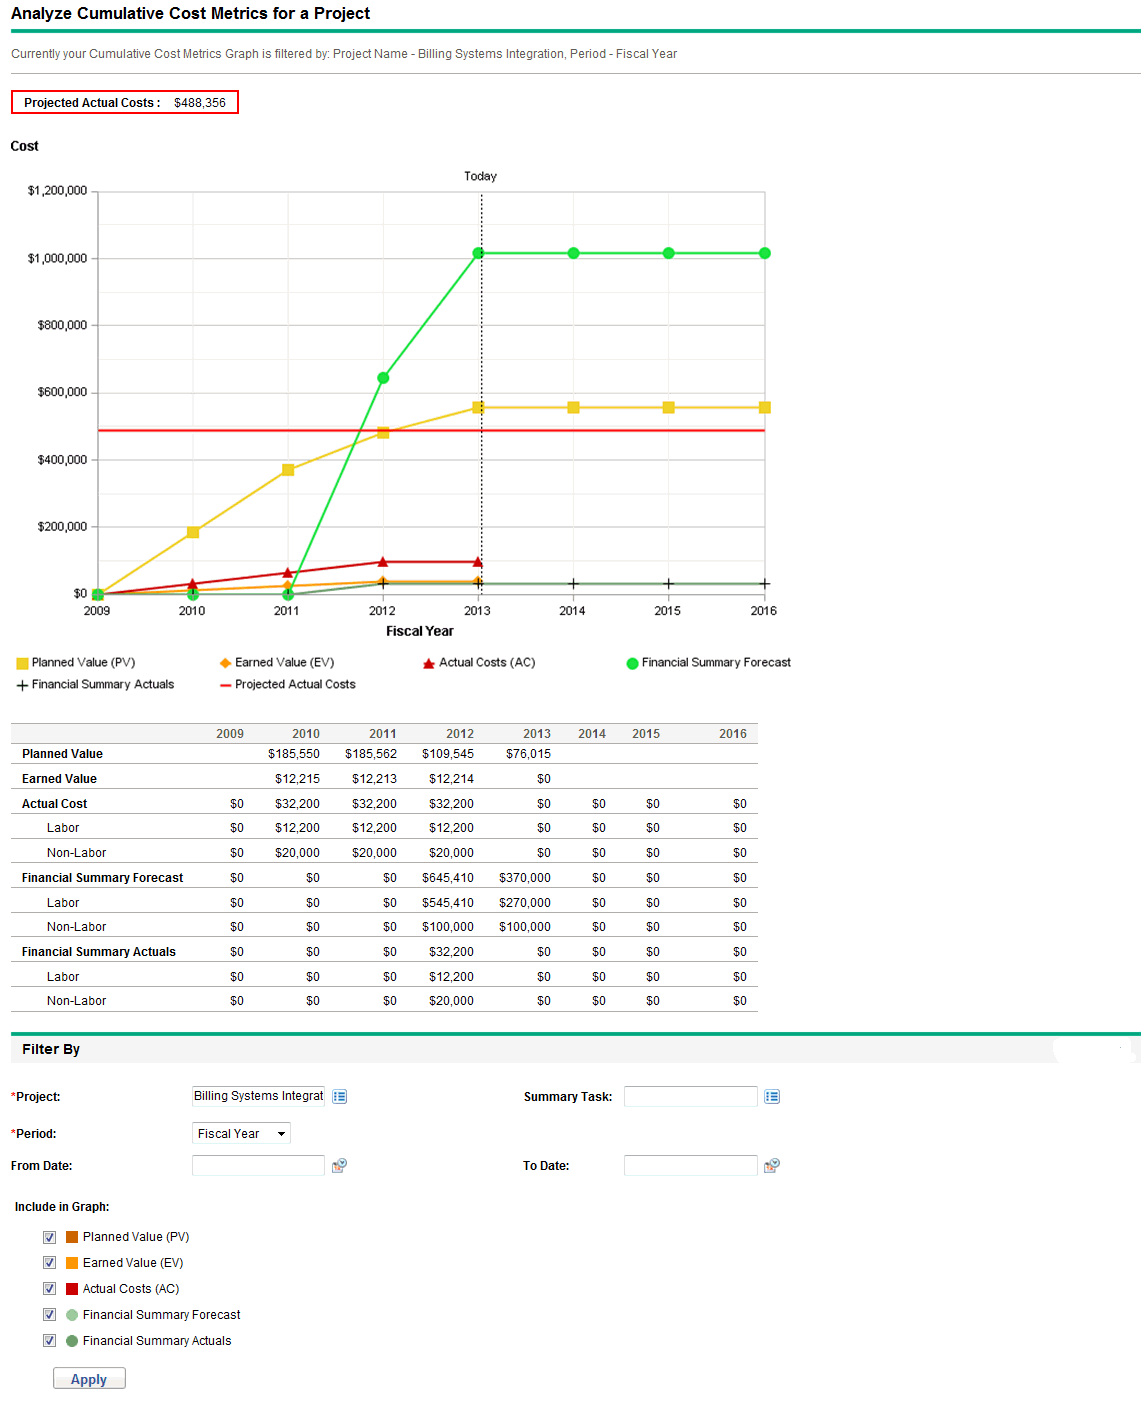
Use the Analyze Cumulative Cost Metrics page to evaluate a project's performance in terms of different cost variables over time. Project Management calculates the Projected Actual Cost field for the project as baseline cost / CPI, and the value is displayed above the graph.
Note: The Pending Cost EV Update Service must be enabled for the data in the Analyze Cumulative Cost Metrics page to be made current and kept current.
To view the Analyze Cumulative Cost Metrics page for a project, do one of the following:
-
From the main menu, select Financial Management > Analyze Costs > Project Cumulative Cost Metrics and select a project using the filter criteria.
-
If the project is open and has been set as a baseline, on the Project Summary tab, in the EV Summary section, click Analyze.

|
Field Name |
Description |
|---|---|
|
Project |
Project to be analyzed. |
|
Summary Task |
Summary tasks to be analyzed. |
|
Period |
Period to be used in the graph's time axis. Possible values: Fiscal Week, Fiscal Month, or Fiscal Year. |
|
From Date |
Date at which to start the graph. |
|
To Date |
Date at which to end the graph. |
|
Include in graph: |
|
|
Planned Value (PV) |
Graphs the portion of the Baseline Cost planned to be spent between the project's start date and each data point. |
|
Earned Value (EV) |
Graphs the portion of the Baseline Cost for the entire project that has theoretically been spent by each data point. See for the applicable formula. |
|
Actual Costs (AC) |
Graphs the total dollar cost (Actual Labor Cost + Actual Non-Labor Cost) for the project. |
|
Financial Summary Forecast |
Graphs the financial summary forecast values for the project at each data point. |
|
Financial Summary Actuals |
Graphs the financial summary actual values, if any have been entered, at each data point. |
Project Current Cost Metrics
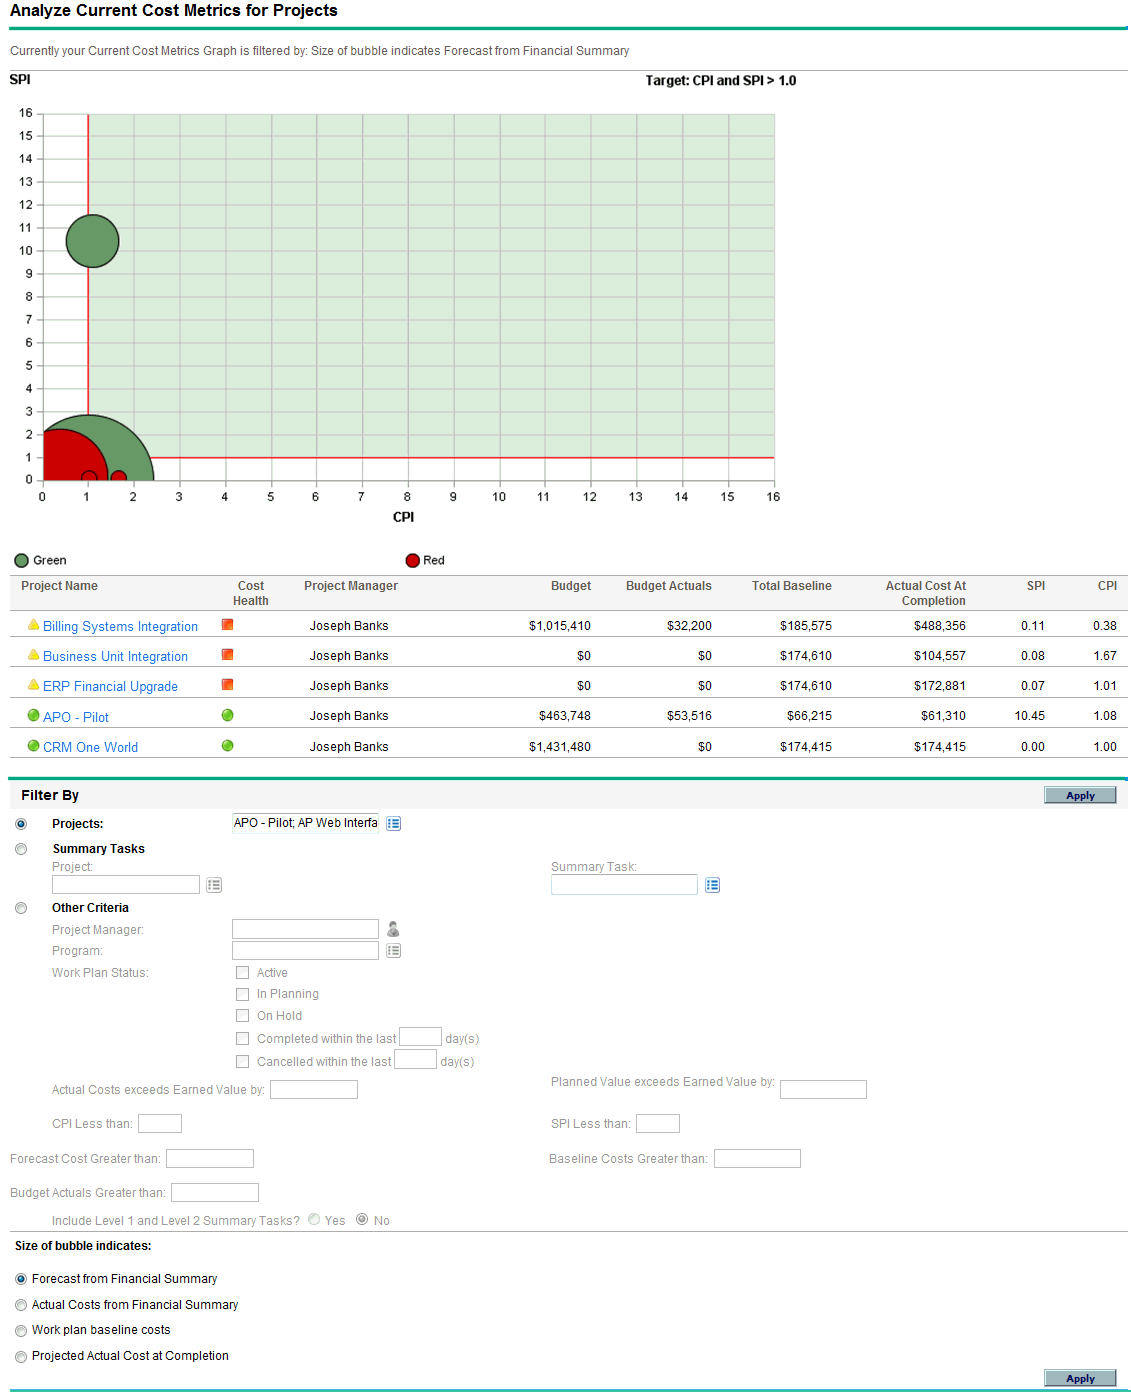
Use the Analyze Current Cost Metrics page to compare the sizes and cost health of one or more projects.
Note: This feature is not supported if your PPM runs on a PostgreSQL database.
To view the Analyze Current Cost Metrics page for projects, from the main menu, select Financial Management > Analyze Costs > Project Current Cost Metrics.

|
Field Name |
Description |
|---|---|
|
Projects |
|
|
Projects |
Projects to be included on the page |
|
Summary Tasks |
|
|
Project |
Project to be included on the page |
|
Summary Task |
Summary task within the project you specified |
|
Other Criteria |
|
|
Project Manager |
Project managers whose projects are to be included |
|
Program |
Programs from which projects are to be included |
|
Work Plan Status |
Projects with work plans having the statuses you specify |
|
Actual Costs exceed Earned Value by |
Projects with a cost variance greater than the amount you specify |
|
Planned Value exceeds Earned Value by |
Projects with a schedule variance greater than the amount you specify |
|
CPI Less Than |
Projects with a CPI less than the value you specify |
|
SPI Less Than |
Projects with an SPI less than the value you specify |
|
Forecast Cost Greater Than |
Projects with a forecast cost greater than the amount you specify |
|
Baseline Costs Greater Than |
Projects with baseline costs greater than the amount you specify |
|
Budget Actuals Greater Than |
Projects with actual costs (from the financial summaries) greater than the amount you specify |
|
Include Level 1 and Level 2 Summary Tasks? |
Option to include summary tasks of level 1 or 2 within the work plan hierarchy |
|
Size of bubble indicates |
|
|
Forecast from Financial Summary |
Option for bubbles representing projects to vary in size based on the size of their associated forecasts from the financial summary |
|
Actual Costs from Financial Summary |
Option for bubbles representing projects to vary in size based on the size of their actual costs from the financial summary, if any have been entered |
|
Work plan baseline costs |
Option for bubbles representing projects to vary in size based on the size of their last work plan baseline costs |
|
Projected Actual Cost at Completion |
Option for bubbles representing projects to vary in size based on the size of their projected actual cost (baseline cost / CPI) at completion |


