Visualize assignments
A basic task for project managers and request managers is to ensure that work items are assigned to their team members without overloading anyone. This task of balancing the assignments of all resources is called load balancing.
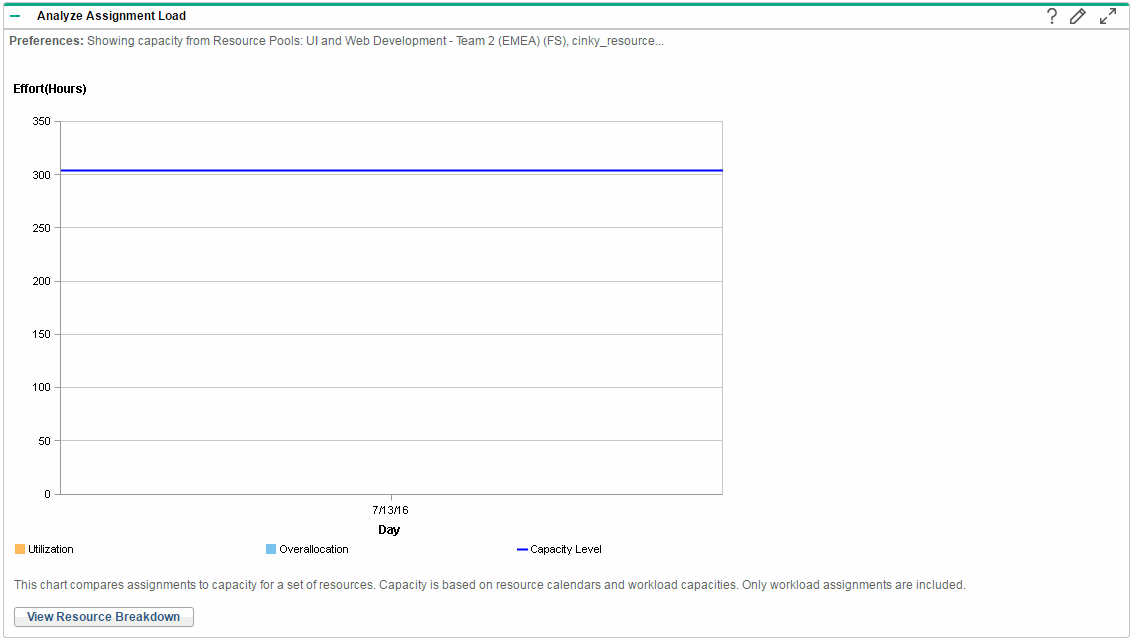
The Analyze Assignment Load portlet provides a tool for visualizing assignments that allows a manager to view workload sorted according to different criteria and levels of specificity, giving them better control and visibility over their resources' workload.
Figure 5-16. Analyze Assignment Load portlet shows the Analyze Assignment Load portlet, which can help a manager rapidly pinpoint areas of over- or under-allocation.
Figure 5-16. Analyze Assignment Load portlet

|
Name |
Description |
|---|---|
|
Utilization |
The amount of effort that has been allocated to the selected resources during the time period. |
|
Overallocation |
The amount of effort that exceeds the capacity level of the selected resources. |
|
Capacity Level |
The maximum amount of effort that can be allocated to the selected resources during the time period. |
The Analyze Assignment Load portlet can be filtered according to the parameters described in Table 5-15. Analyze Assignment Load portlet - parameters.
Note: If a staffing profile is completed, future forecast and assignments (those past the finish date of the staffing profile) can be cleared and will not display in the portlet. See Clear future forecast and assignments for more information.
If large amounts of data are supplied to the portlet, there may be performance problems. Therefore, a threshold for this portlet can be specified in the server.conf file and a default value is provided for optimal performance.
-
AAL_PORTLET_MAX_RESOURCES: the maximum number of total resources. The default value is 300.
See the Installation and Administration Guide for more information about editing the server.conf file.
When the threshold is exceeded, the portlet does not display. Instead, a message containing the threshold value and current value that exceeds the threshold appear. To make the portlet display, you can edit the preferences of the portlet so that the threshold is no longer exceeded. It is not recommended to increase the threshold value as this may cause performance problems.
If the amount of data you need to analyze exceeds the threshold, you can export the data to Microsoft Excel. To export Analyze Assignment Load portlet data to Microsoft Excel, do the following:
-
Select Open > Resource Management > Data Exports > Analyze Assignment Load.
-
Set the filter criteria for export.
An additional field is included for the filter criteria: Include Detailed Data. Select this checkbox if you want to get a breakdown of total resource capacity and workload (data displayed in the Analyze Assignment Load Breakdown table).
-
Click Export To Excel.
The date when the snapshot was taken is included in the export.
Note: The data may not contain decimal places. Therefore, numbers such as 2.47 may display as 3.


