Share this page


Predefined self-service portlet data sources
This topic introduces the predefined self-service portlet data sources that are ready for use.
Financial Costs
You can use the Financial Costs data source in the self-service portlet to display financial costs for projects, programs, portfolios, assets, and proposals.
Prerequisite
To use this data source, you must have either of the following licenses:
-
The Demand Management license
-
The Project Management license
-
The Program Management license
-
The Portfolio Management license
-
The Configuration license
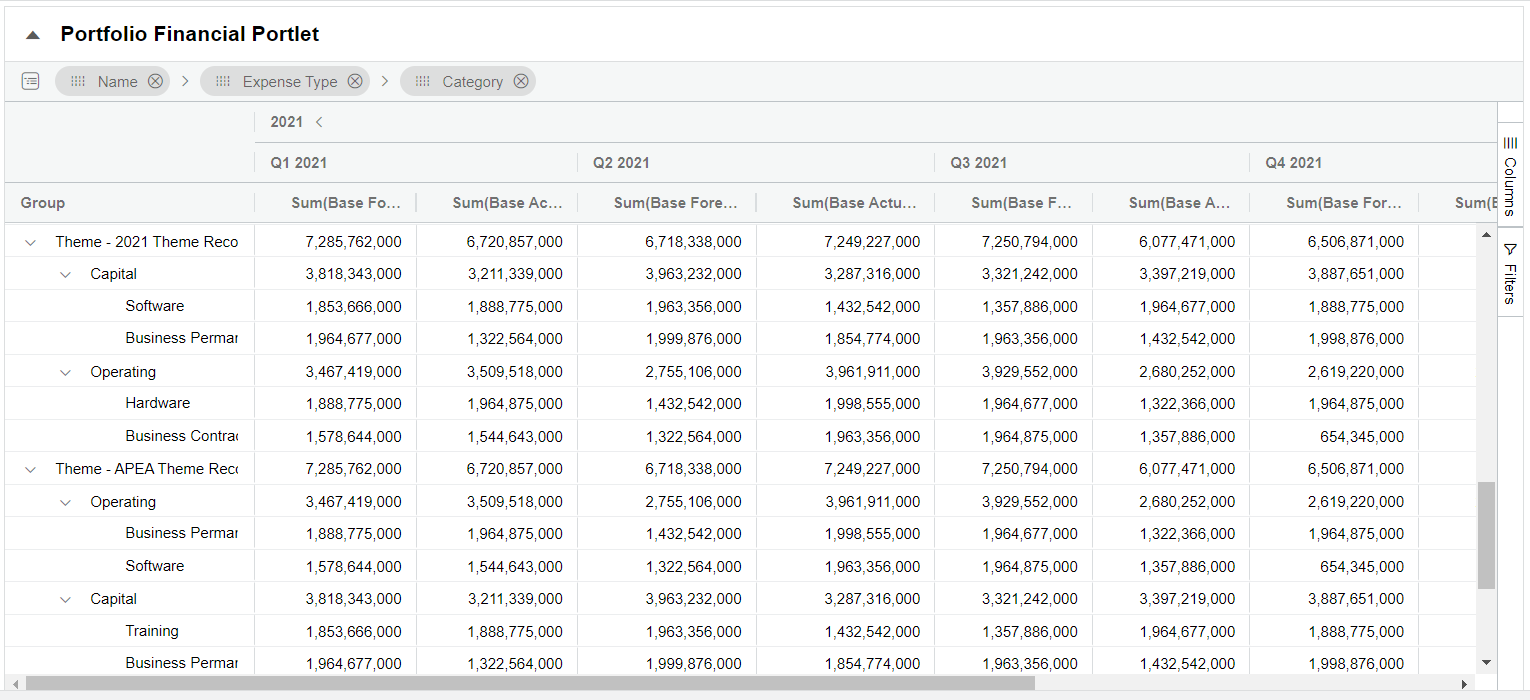
Financial Costs data source columns
The following table lists the columns in the Financial Costs data source. You can use these columns in the self-service portlet to display the financial costs for a desired entity.
| Column | Description |
|---|---|
| Base Actual Cost | Select this column if you want the self-service portlet to include the entity's actual cost in the base currency. |
| Base Forecast Cost |
Select this column if you want the self-service portlet to include the entity's forecast cost in the base currency. |
| Category |
Select this column if you want to display cost category in the self-service portlet. The cost category includes: Contractor, Employee, Hardware, Software, and Training. |
| Expense Type |
Select this column if you want to display the cost expense type in the self-service portlet. The expense type includes Operating and Capital. |
| Labor Type |
Select this column if you want to display the cost labor type in the self-service portlet. The labor type includes: Labor and Non-Labor. |
| Line ID |
In the Pivot Mode of the Grid view, use the Line ID column to consolidate information from multiple columns for a cost line. The Line ID combines data from these columns in left-to-right order:
You can select the information included in the Line ID by selecting the desired columns. Example: A cost line has the following properties:
If you select these columns: Category, Labor Type, User data, and Line ID, the Line ID column displays: Employee, Labor, ABC If you select these columns: Category, Labor Type, Expense Type, Source, and Line ID, the Line ID column displays: Employee, Labor, Capital, Staffing Profile |
| Local Actual Cost |
Select this column if you want the self-service portlet to display the entity's actual cost in the local currency. |
| Local Forecast Cost |
Select this column if you want the self-service portlet to display the entity's forecast cost in the local currency. |
| Month |
Select this column if you want to display the financial costs by month in the self-service portlet. |
| Name |
Select this column if you want to display the name of the entity and its contents (if any). This enables you to view the financial costs of an entity's contents. |
| Quarter |
Select this column if you want to display the financial costs by quarter in the self-service portlet. |
| Source |
Select this column if you want to display the cost source in the self-service portlet. The cost source is where the cost comes from: rolled up from staffing profiles, work plans, time sheets, or is manually added. For portfolios and programs, the cost can also be rolled up from their contents. |
| Type |
Select this column if you want to display the entity type in the self-service portlet. |
| User data | Select this column if you want to display the cost line user data in the self-service portlet. |

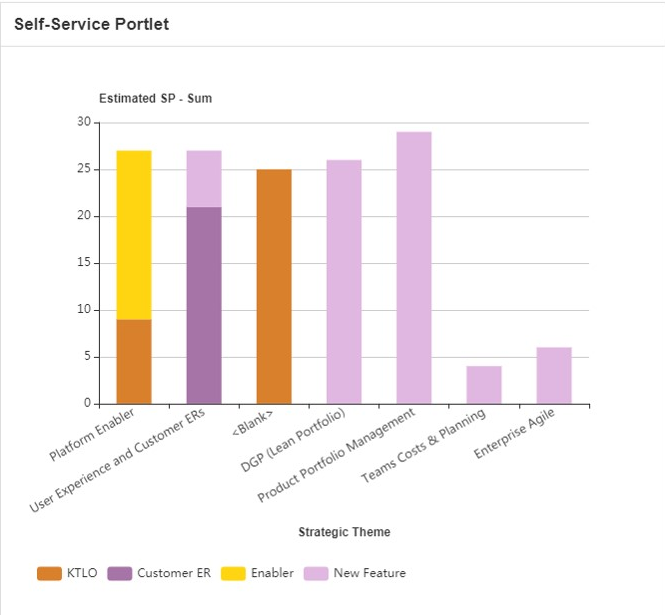
Portfolio Items
You can use the Portfolio Items data source in the self-service portlet to display portfolio information based on specific criteria, including strategic theme, status, health, and so on.
You must have the Portfolio Management license to use this data source.
KPIs
You can use the KPIs data source in the self-service portlet to display KPI information based on specific criteria, such as strategic themes and business goals.
Staffing Profile Statistics
You can use the Staffing Profile Statistics data source in a self-service portlet to analyze team or staffing profile data, including:
- Demand and fulfillment by role or project.
- Allocations by resource or position.
Tip: For performance considerations, demand and allocation data cannot be viewed simultaneously. You can configure a drill-to view to access detailed allocation for fulfilled demand. For details, see Define a drill-to view for a favorite view.
Filter options
Customize the data displayed in the portlet using the following filters:
| Filter | Description |
|---|---|
| Data source preferences |
The Staffing Profile Statistics data source includes the following data source filters:
|
| Field filters |
The Staffing Profile Statistics data source includes the following data field filters:
|
Add custom fields to Staffing Profile Statistics data source
Available for: 25.2 and later
Admins can add fields from staffing profile associated entities, including project, proposal, and asset, to the Staffing Profile Statistics data source. This enables users to analyze demand and allocation data from custom perspectives. For example, adding the Priority field lets users track resource allocation by priority level.
To add custom fields:
-
Click the Administration button
 in the masthead.
 -
From the Administration menu, click Dashboard Configuration > Manage Self-Service Portlet Data Sources.
-
Click the Staffing Profile Statistics data source link to open the Edit Self-Service Portlet Data Source page.
-
In the User Defined Columns area, the table on the left lists fields from the project, proposal, and asset request types.
Note: If a field with the same token exists in multiple request types, only one is listed.
-
Select the checkboxes for the fields that you want to add as data source fields and click the Add
 button.
 -
The selected fields are added as data source fields and appear in the Columns area on the Edit Self-Service Portlet Data Source page.
- Numeric and date fields keep their original type in the data source. All other fields are treated as strings.
- Numeric fields can be used for aggregation; date and string fields can be used as filters.
-
If a user has no view access to a field, string fields displays as
""; numeric and date fields display as blank.
-
(Optional) To customize a field's display name in the self-service portlet, go to the Columns area and edit the Custom Column Label property for that field.
Note: If a custom field is removed from the Starring Profile Statistics data source after it is already added to self-service portlets, the portlets may no longer function as expected. You need to edit and update the portlets accordingly.
Discrepancies in Staffing Profile Statistics
When using the Staffing Profile Statistics data source, the data may have the following discrepancies:
| Discrepancy | Details |
|---|---|
| Demand for sub-teams at level three and higher | When a team has multiple sub-team levels, only the current team and its direct sub-teams are displayed. Demand, Fulfillment, Unmet Demand, and Percentage Fulfilled values for level three and higher sub-teams are rolled up to the level two team. |
| Time period impact on FTE demand |
When displaying Demand, Fulfilled Demand, or Unmet Demand using the Full Time Equivalent (FTE) effort type, the values may vary depending on the selected time period. For example, if a position has a demand of 2 FTEs for each month in August and September but none in July and October, selecting August to September will show 2 FTEs of demand for each month in that period. In contrast, selecting July to October will show an average demand of approximately 1 FTE per month over the four-month period. If you use the Person Days or Hours effort type, the values remain constant regardless of the time period selected. |
| Region impact on FTE demand |
When displaying demand using the Full-Time Equivalent (FTE) effort type, the calculation uses the working hours, working days, and holidays defined in the regional calendar settings of the resource pool specified by the position. If multiple regional calendars are applied, the FTE demand may be inaccurate. |
| Region impact on FTE allocations |
When displaying allocations using the Full-Time Equivalent (FTE) effort type, the calculation uses regional calendar settings, including working hours, working days, and holidays.
If multiple regional calendars are used, FTE allocation may be inaccurate. |
| Percentage Fulfilled value |
In some cases, Percentage Fulfilled (%) may not display as expected. For example, when using the Card chart to show overall percentage fulfilled for a period, it will show a sum instead of an average. |
 See also: