View your run results
You click the Stop button
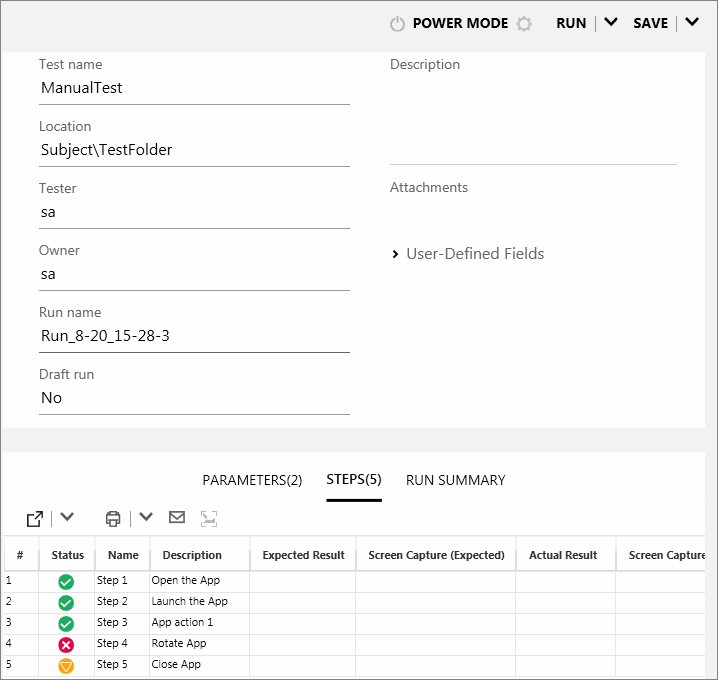
 in the Run Control sidebar to end the run. The sidebars close and the Run Summary pane opens in the main window. The summary includes: test and run information, the number of actions you performed (Power Mode tests only), the number of defects you submitted, the number of defect reminders you created, the number of comments you added (Power Mode tests only), and the statuses of the steps you performed.

Each of the tests in the My Runs List pane can be selected to display more details in the right pane.
For ALM or ValueEdge/Octane, you select the Run Defects node to view a list of the defects you submitted during your test.

You can click the Defect ID number to
You then open the Defect Reminder tab to view a list of the defect reminders you created during your test.

You select a reminder and click Submit Defect, to submit the defect. All the information for the defect is still available in the run results. You can include an annotated screen capture, a movie, the step information or user action information with your defect.
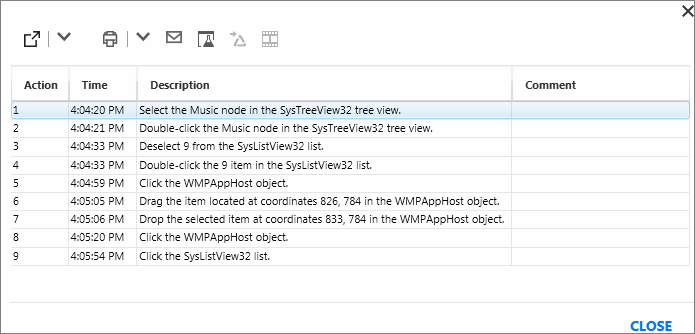
Since you decided to run your test in Power Mode, you select the User Actions node and view a list of the user actions you performed during your run.

This list of user actions can be exported to an Excel spreadsheet
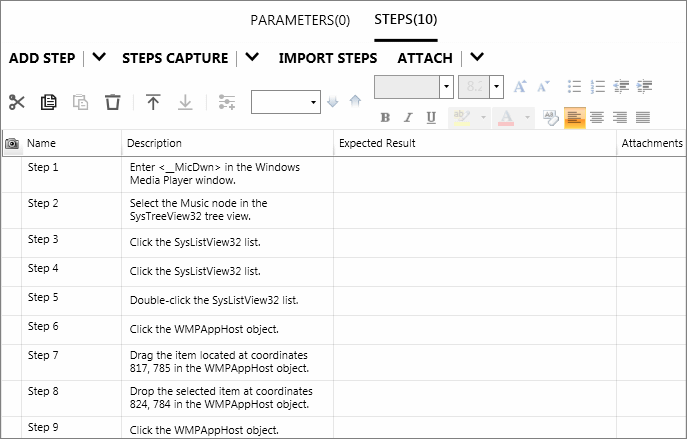
You click the Generate Test button to use the current test run as a template for creating a new manual test.

You open the Steps node to see details about each of the steps. The summary includes Status, Name, Description, Expected and Actual Results, Screen Captures, and Attachments.
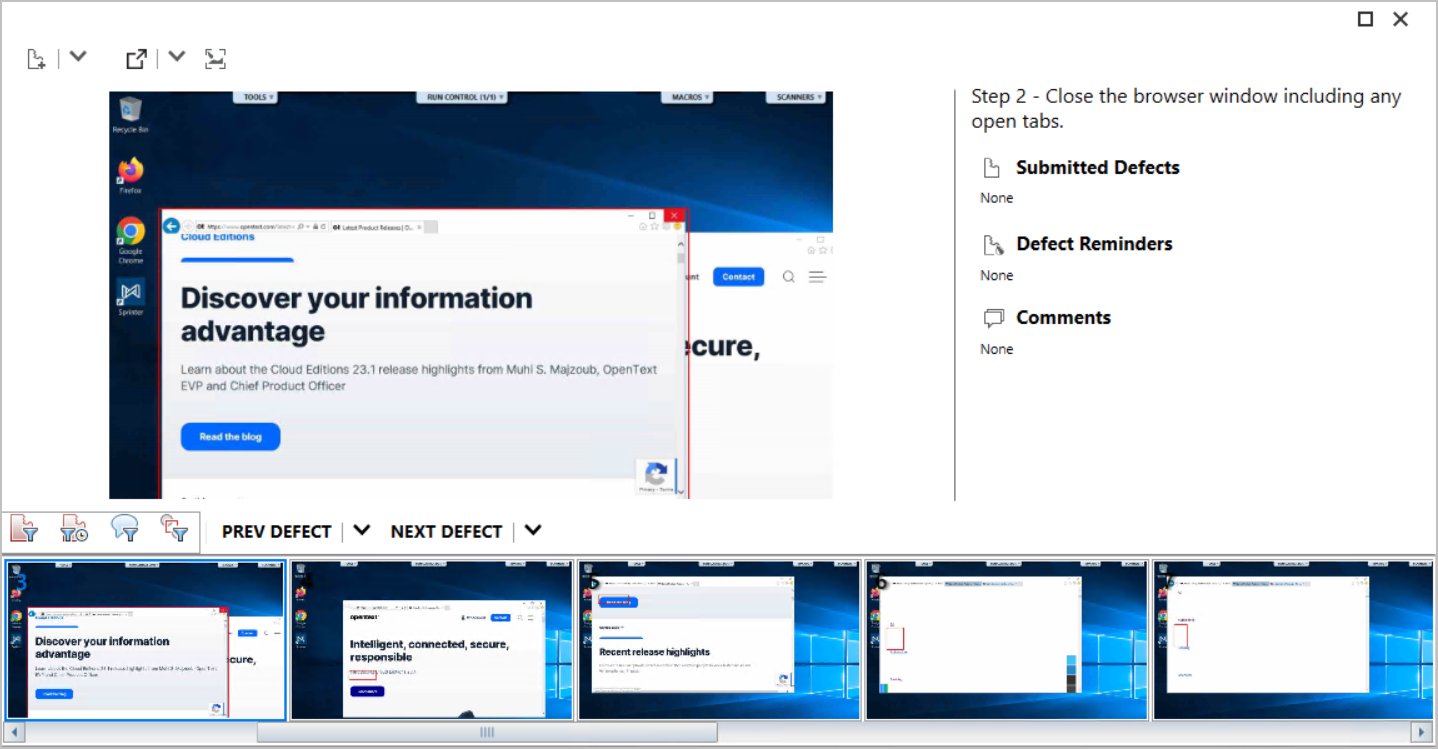
You then select the Storyboard node and the Storyboard opens. The top of the Storyboard displays a screen capture of your application as it appeared after the selected user action in the Timeline was performed, and an Action Summary pane. The bottom of the Storyboard displays a Timeline of your run.

In the Action Details pane you view a description of each action and any defects that were submitted, defect reminders or comments that were added.
In the Action Details pane you view a description of each action and any defects that were submitted, or defect reminders or comments that were added.
You can click the links in the Action Summary pane to open the Defect Details dialog box, create a defect from your defect reminder, or open the Differences Viewer. You can also submit a new defect from the Storyboard.
The bottom of the Storyboard displays the Timeline of your test. The Timeline contains a thumbnail screen capture of each user action in your test. You can filter the thumbnails that are displayed in the Timeline to show only those actions where you submitted a defect, only those actions where you created a Defect Reminder, only those actions where you added a comment, or only those actions where differences were found.
Now that you've walked through the basic processes of configuring, running, and viewing the results of this imaginary test, you are ready to get started using Sprinter.


