Share this page


Simulation report
The simulation report provides a detailed look into the simulation process. The report shows the steps that were performed by the simulation engine when processing request data and generating a response, before sending the response back to the client. To learn more about how simulation works, see The Simulation Process.
Troubleshooting simulation
The simulation process is inherently complex. If your data model consists of many rules, conditions, and actions, it can be difficult to troubleshoot to find the source of unexpected results of the simulation. While Simulation Preview can assist you in assessing one rule at a time, the Simulation Report provides much more detail. You can see the complete sequence of steps performed to create the final response. The report also provides timing information which can help you identify performance bottlenecks.
Generate a simulation report
-
Prerequisites:
Enable the simulation report for a virtual service for which you want to generate a report.
In the Virtual Service Editor, under Service Debugging, enable Simulation Report.
Caution: Enable simulation reports for a minimum period only. For example, enable the reports, run a short simulation, and then disable the reports. Service Virtualization generates a new file for every request. The file can be quite large, depending on the size and complexity of your data model. This has a significant impact on Service Virtualization performance.
-
Generate the report.
To generate the report, run the virtual service in Simulation mode, or open Simulation Preview.
-
View the report. In the Virtual Service Editor, under Service Debugging, click Show Service Logs.
Alternatively, you can access the reports from the file system. Generated reports are stored as a subdirectory of the logging directory:
For the embedded server in the Service Virtualization Designer %APPDATA%\Micro Focus\Service Virtualization Designer\logs\reports\<service name_service id> For the Service Virtualization Server %ALLUSERSPROFILE%\Micro Focus\Service Virtualization Server\logs\reports\<service name_service id> Note: A report generated in Simulation Preview is named SimulationPreview.html. The report file is overwritten each time you open the Simulation Preview.

Understanding the simulation report
The first page of the report provides a brief overview of the simulation that was performed.
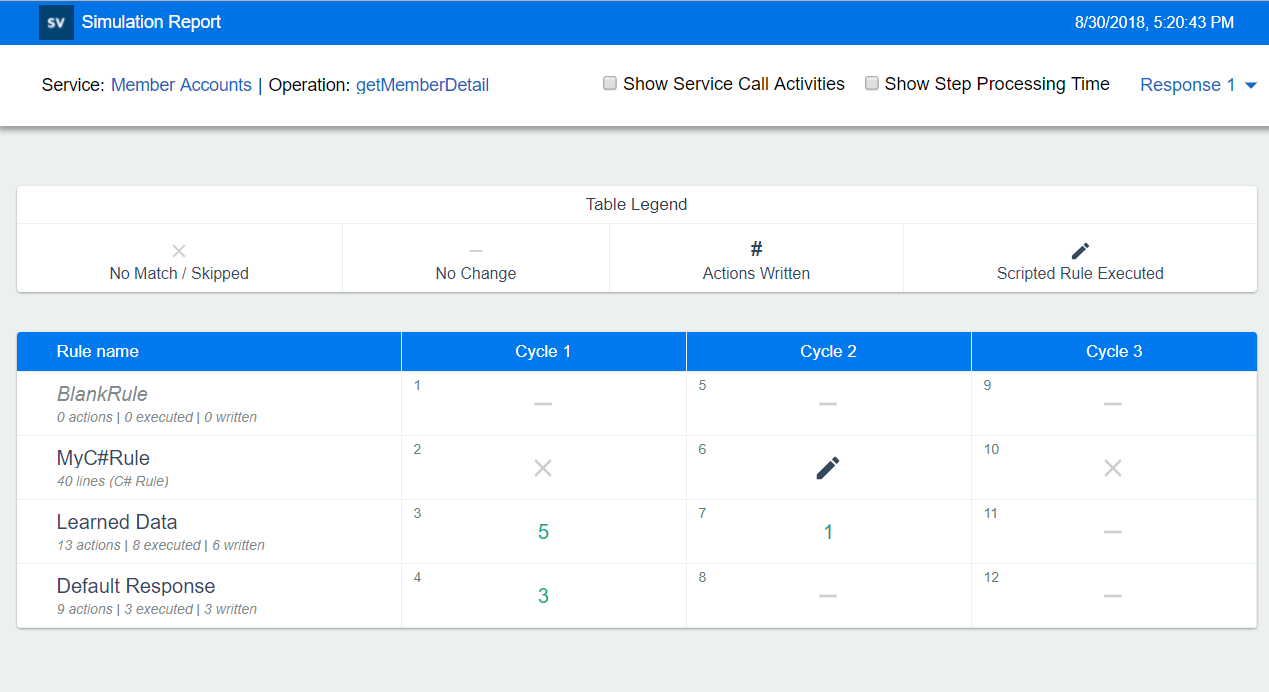
Simulation Report Overview Page
The Overview page shows:
- The service or operation name.
- A list of the rules in your data model.
- Cycle information. For example, Cycle 1 shows a summary of the all the rules in the data model during the first simulation.
- The number in the left column of each cycle indicates the stage in which the step was performed during simulation.
- The colored number in the middle column indicates the number of actions written to the selected response during this step. Use the Response drop down to select a response number.
- An X indicates that the request data did not match any row in the related rule.
To show additional data, select Show Service Call Activities (if your data included service call activity) or Show Step Processing Time.
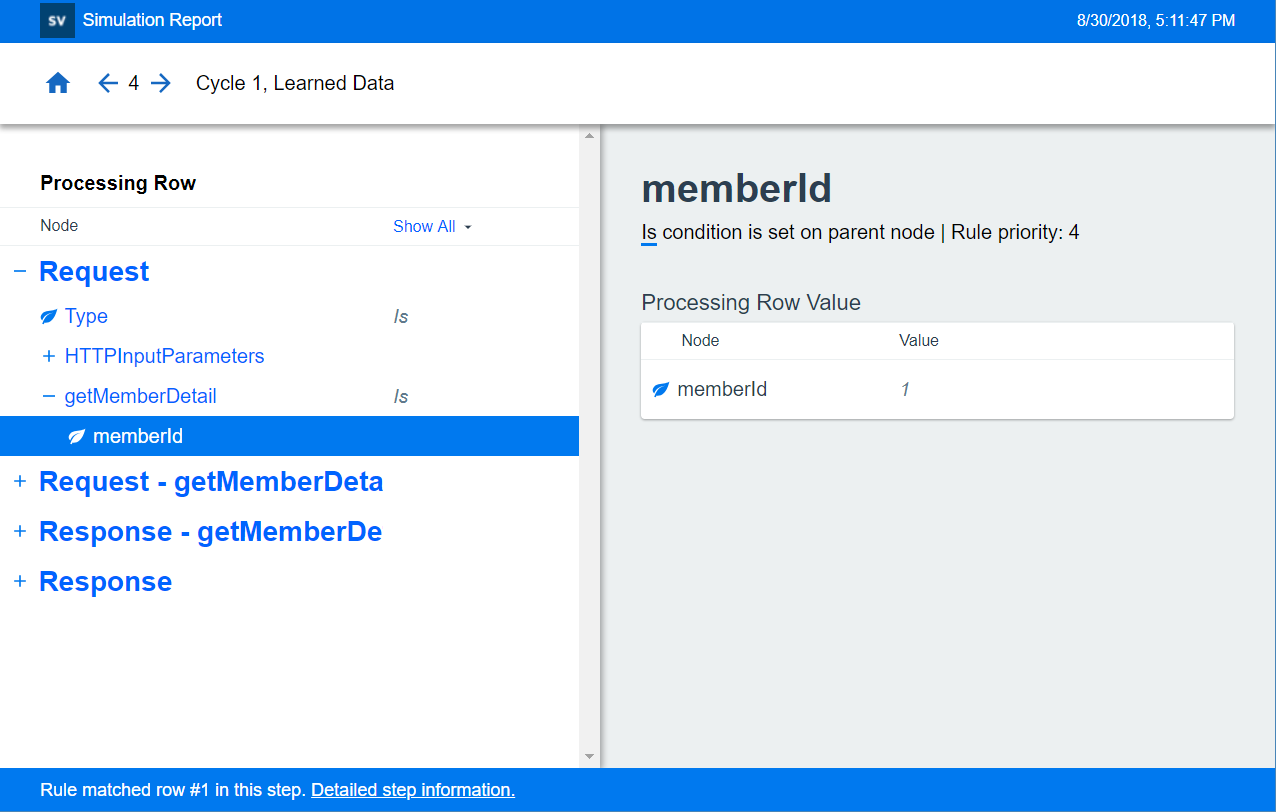
Simulation Report Detail Page
To view more details about a step, click on it in the overview page.
Click on the Home button to return to the overview page.
Use the Navigation buttons to move between steps.
The following table describes the user interface of this data window:
| Left pane |
Details of the processing row. The processing row refers to the internal data structure being used and compiled by Service Virtualization. The processing row contains a request section and a response section. If the data model contains Service Call Activities, the processing row contains request and response sections for these as well. Before the simulation process begins, the request section is initialized from the incoming request. Then the simulator starts the first cycle of evaluating all data rules one at a time based on their priority, and begins to compile the response. When all rules have been evaluated the simulator starts another cycle. As soon as the simulator completes a cycle with no changes to the processing row, the simulation process ends. The response section of the processing row is then sent back to the client as the Service Virtualization response. |
| Filter |
Select an option to filter the detail view. This is particularly useful when viewing a complex processing row. Show All. Displays all data for the processing row. Show Actions. Displays only the values that have an associated action within the rule. Show Conditions. Displays only the values that have an associated condition within the rule. Show Changed Nodes. Displays only the values that were changed during the selected step. |
| Right pane |
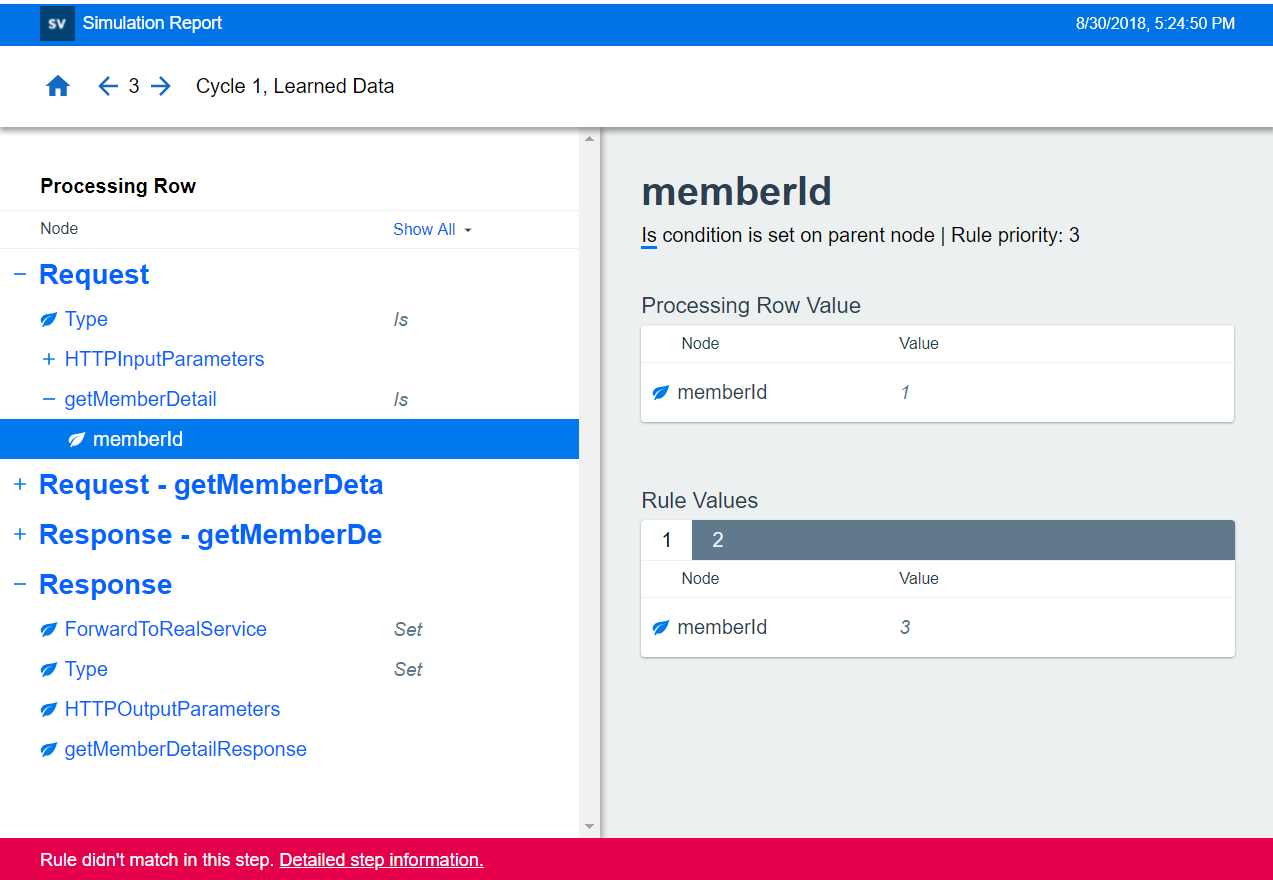
Details of the value selected in the processing row. No matching row: When no matching row was found in the data rule during a step, you can view and compare the processing row value with the rule values for each condition. Select any node in the processing row to display its details in the right pane.
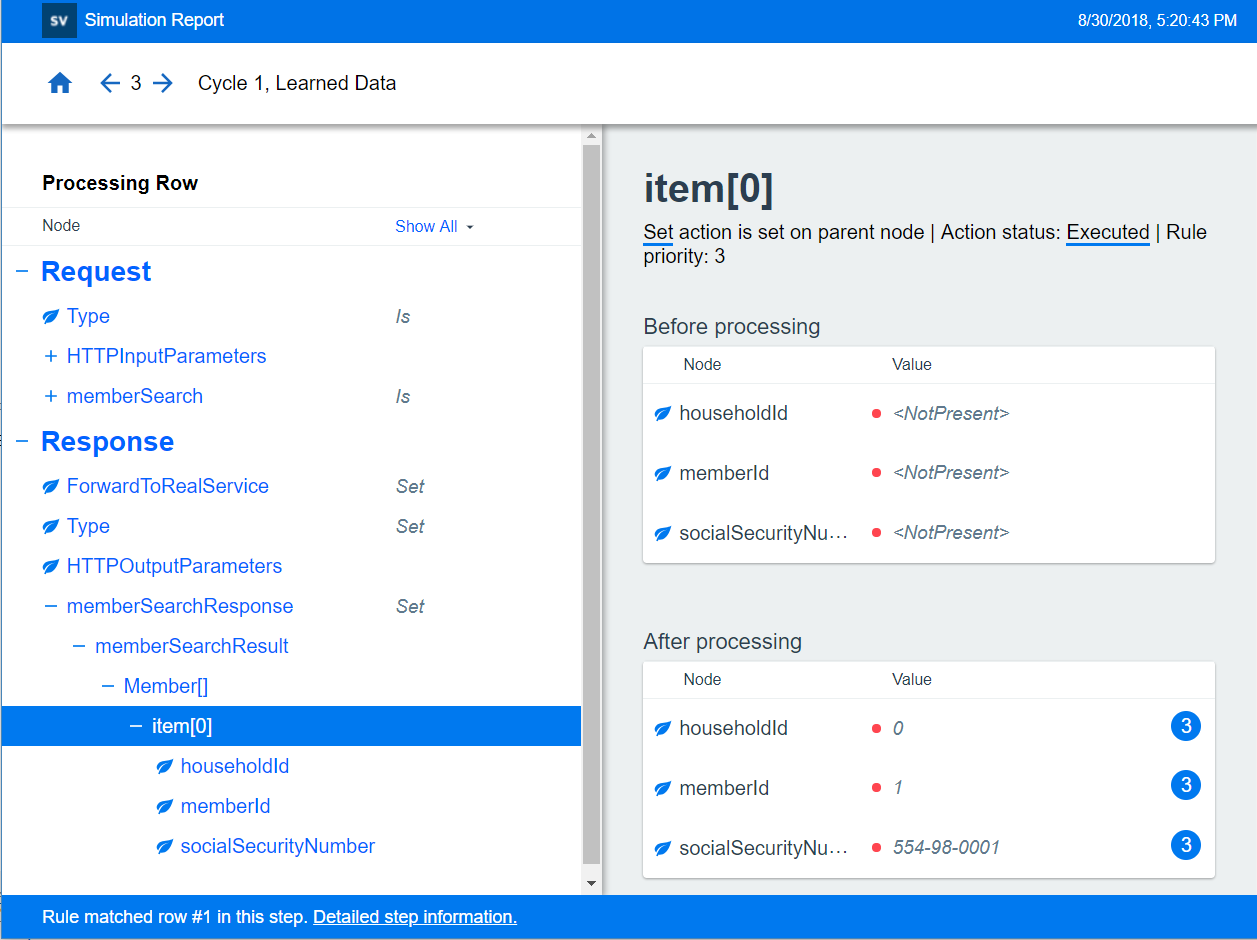
Matching row. When there was a matching row in the data rule, you can see the original value and the new value in the processing rule. You can also see the priority of the rule that wrote the value.
|
Use case scenarios
Why didn't the client request match any rules in my data model? Why didn't my rule write any response data? Explore a few common use case scenarios to help you answer those questions: Simulation Report Use Cases.
Known limitations
Only the first difference is displayed. When the simulator tries to find a matching row in a data rule, it stops when it detects the first difference, although there may be multiple conditions for which the rule row does not match the processing row. Only the first such difference is shown in the simulation report. Therefore, if for example you modify the rule row to match according to this single difference, the row may still not match due to other differences not originally shown in the report.
Only a subset of rows is included within the report. The simulation report includes up to ten rows for each rule. When the rule does not match, only this subset of ten rows per rule are shown on the detail page of the report. Information on the additional rows is not currently available.
Scripted rule details are not available. The simulation report shows the processing row as of the end of each step. That means that if the scripted rule performs several changes to a processing row within a particular step, this sequence is not provided. Only the final result is displayed. In addition, a scripted rule can write a value to several contexts. These additional contexts are not visible from the report.
Report size. Since the simulation report is a single self-contained file, it needs to fit into browser memory. Some browsers may refuse to display extremely large reports.
Security limitation. If you send the report file to another computer, it may not open in Internet Explorer. This is due to Windows security. To enable Internet Explorer to open the report, right-click the report file, select Properties, go to the General tab, and select Unblock.
Supported browsers. The simulation report as an early access feature supports only recent versions of browsers. These currently include:
- Internet Explorer version 10 or later
- Firefox version 43 or later
- Chrome version 48 or later