Share this page


Monitor servers and services
Monitor the servers and services you are managing with Service Virtualization Management.
Monitor virtual services
Click the Services tab.
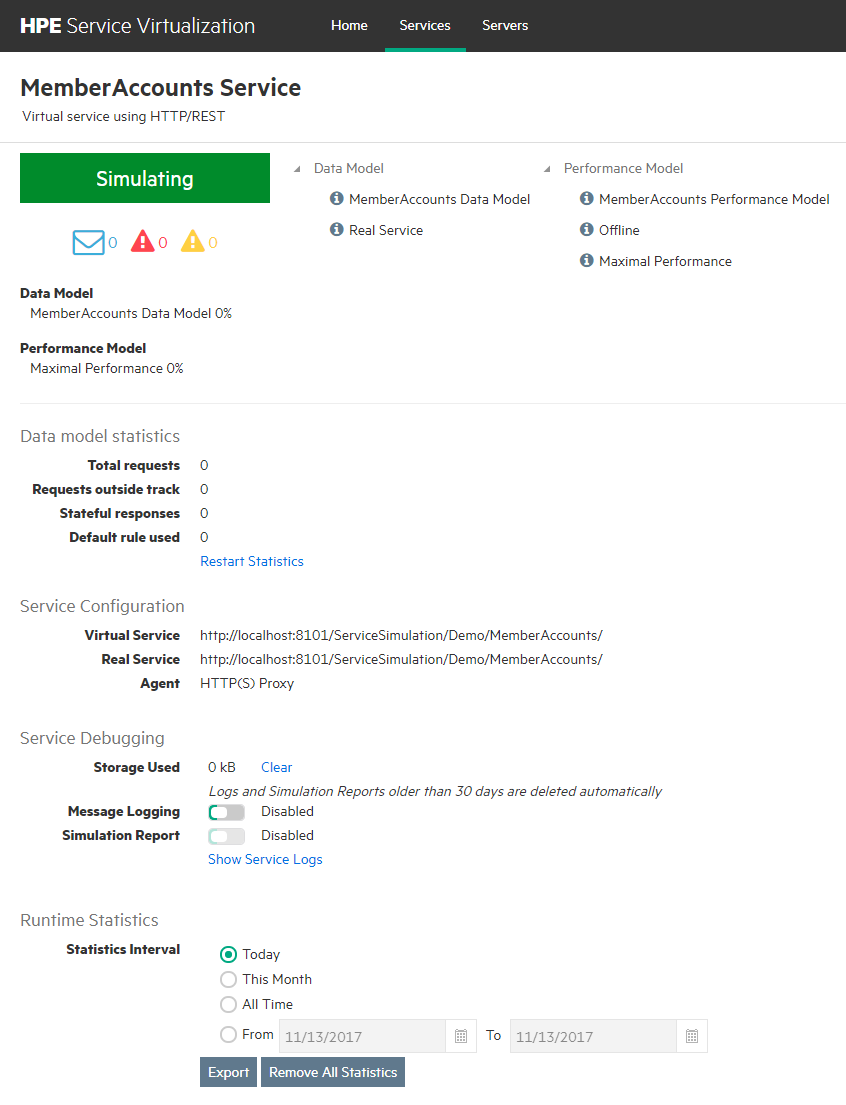
For each service, the following information is displayed:
|
Service Name |
The name of the virtual service. |
|
Protocol
|
The message and transport protocols in use in the virtual service. |
| Mode |
View or change the mode of the virtual service: Simulating. The virtual service responds to client requests, and the real service does not receive any communication. Learning. The virtual service works as a proxy to record and learn the behavior of the real service. Standby. The virtual service redirects requests to the real service, and redirects responses from the real service back to the client. Offline. The virtual service is unavailable. This may indicate an error in the service's configuration. |
|
Models
|
The Data and Performance simulation models currently in use for the selected service. Simulation model accuracy is displayed for services in Simulation mode. The percentage indicates the accuracy of data or performance model emulation of the real service by the virtual service. |
| Messages/ Errors/Warnings |
Indicates the number of messages, errors and warnings that occurred during the application or server run. Errors and Warnings are displayed when a problem occurs during a service lifecycle, such as during deployment, or while in Standby, Learning, or Simulating modes.
|
| Data model statistics |
General statistics about the data model:
Restart Statistics. This link zeros out the current values. |
| Service Configuration |
The endpoints of the virtual and real services and the Agent. |
| Service Debugging |
Show Service Logs. Opens a window showing the message and service logs. |
| Runtime Statistics |
The interval of time for which to export the statistics: Today, This Month, All Time, From ...To. Export. Export all statistics according to the above selection. The exported HTML file includes details about each service, such as service name, mode, deployment state, and models. You can see an overall picture of the deployed services, and identify any problem areas, such as simulation accuracy. Remove All Statistics. Delete all existing statistics and begin collecting them at this time. |

 Messages
 Warnings
 Errors
View a summary of server activity
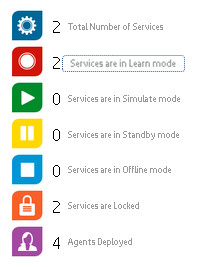
The Home tab displays the Dashboard - a selection of statistics and graphs for all of the Service Virtualization Servers you are managing. You can view statistics on the services and protocols that are deployed on the server.
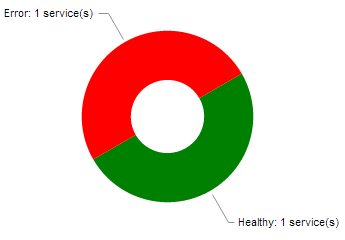
Tip: Click inside a graph to drill down to more details on the relevant services or servers.
The Dashboard displays the following server protocol and health statistics.
| Server Health Chart | The percentage of services deployed on the server that contain errors, and the percentage of services that do not have any errors. | ||
| Server Protocol Distribution | The percentage of services using each protocol deployed on the server. | ||
| Top 5 Servers by Hardware Utilization |
The 5 configured servers with the highest utilization of server memory usage or server CPU usage, defined as the higher of the two. The scale for each server displays 4 bars, where:
For example:
|
||
| Bottom 5 services by Data Model Accuracy | The 5 services with the lowest accuracy of data model emulation of the real service by the virtual service. |
 Medium utilization
  Very high utilization