Share this page


View and analyze statistics
View and analyze statistics that are collected for your Service Virtualization Servers and virtual services.
Service statistics
Service statistics are maintained for each virtual service deployed on the Service Virtualization Server. If the service is undeployed, statistics are removed.
Note: If you want to maintain service statistics, you can change the default configuration. For details, see Preserve service statistics.
Examine virtual service statistics to detect any problems, evaluate how the services are used, or identify where there might be opportunities for improvement. For example, if data model accuracy is poor, you may need to reconsider your data model configuration, or add more recorded data to the model.

Service statistics for a single service
In the Services tab, click a service name. On the service detail page, under Runtime Statistics, you can do the following:
Statistics are continually collected by Service Virtualization, and then aggregated and displayed at regular intervals.
Tip:
- To display statistics using bar graphs instead of line graphs, click Chart Settings
 . Clear the Show line graph option.
 - Use your mouse to scroll through the data in the chart or graph.
- In the Aggregated Statistics tab, select a time interval.
-
Select the statistics you want to see. Click a statistic on the legend to show or hide its data in the graph.

-
Hover over points on the graph to show details of a specific point in time.
Simulation Time Cumulative statistic showing how long, in hours, the virtual service was in Simulation mode during the given interval. Simulated Transactions The cumulative number of calls counted while the service is in Simulation mode. Response time The time for the virtual service to process a request and return a relevant response. Latency The time used to process a request.
Length of time from when the server starts processing a request until it creates a response.
Transactions per second (tps) The number of responses that the virtual service sent per second. Client count The number of client connections to the Service Virtualization agent. Errors Errors that occurred during the service lifecycle. Warnings Warnings that were generated during the service lifecycle. Data Model Accuracy The accuracy of data model emulation of the real service by the virtual service. Performance Model Accuracy The accuracy of performance model emulation of the real service by the virtual service.
The Events tab displays the list of changes of the service state, simulation restart, and other statistics. For details on each statistic, see View aggregated statistics.
Statistics are saved to a file in .xlsx format in a location that you choose.
- Click Export.
-
In the Export Selected Time Interval dialog box, select a template and other preferences and click Export.
When you select the Aggregation Statistics export type, collected data is averaged according to the Aggregation Interval, and exported according to the Statistics Interval.
Removes all statistics data for the current service.
Service statistics for multiple services
You can export or reset statistics for one or more services on a Service Virtualization Server.
- In the Services tab, select one or more services from the same server.
-
From the Bulk Actions menu on the bottom toolbar, select Export Statistics or Reset Statistics.
For additional details, see Export statistics or Reset statistics.
Server statistics
Examine server statistics to:
- identify and analyze problems on the Service Virtualization Server
- find the best server for service deployment
You can also use the Service Virtualization Server performance counters in other applications, such as LoadRunner, to collect and analyze data.
Server Health statistics provide metrics that monitor server hardware resource consumption.
Server Utilization statistics provide metrics that monitor server traffic.
Running Services statistics display all services on the server by mode. Services not listed are currently offline.
To view server statistics:
- In the Servers tab, select a server.
-
Under Server Health, view a summary of server statistics.
CPU usage Utilization of the CPU showing Min, Avg, and Max values.
Memory usage Utilization of server memory showing Min, Avg, and Max values.
Server errors Total number of errors on the Service Virtualization server: New, in the last 24 hours, and since the last restart.
Database response time The response time for retrieving data from the database showing Min, Avg, and Max values.
Storage used by debug data The amount of storage used by the logs and simulation reports. The values are shown for both deployed and undeployed services.
By default, all data older than 30 days, is deleted automatically. Click Clear Now to manually clear all of the data.
-
Click See detailed server information to view more statistics for all services on the server.
The statistics are based on Windows Performance Counters. You can use them for monitoring your virtual services using third-party tools. For more details, see Performance Monitoring.
Minimum, maximum, and average values are displayed for the time interval currently displayed in the graph.
Server Health Statistics CPU usage Current CPU usage on the Service Virtualization Server machine. Memory usage Current memory usage on the Service Virtualization Server machine. Server errors Number of errors on the Service Virtualization Server.
New = new errors that were logged during the time interval displayed in the graph.
Last 24h = total errors logged in the past 24 hours, with or without a server restart.
Total = total errors since last time the Service Virtualization Server was started.
Latency time The time used to process a request.
Length of time from when the Service Virtualization Server starts processing a request until it creates a response. Displays the average value for all services deployed on the server.
Database response time Communication latency between the Service Virtualization Server and the database. Server Utilization Statistics Transactions per second The average value for all services deployed on the Service Virtualization Server. Connections to the server The number of connections from clients to Service Virtualization agents. Message size The average message size for all services deployed on the Service Virtualization Server. Data throughput The average data capacity for all services deployed on the Service Virtualization Server.
Modify statistics collection and calculation options
You may want to change the default configuration for statistics collection and calculation.
View current settings
Search for the following in the Server log file:
- Sampling Interval - the frequency with which data is recorded.
- Writing Interval - the frequency with which the collected data is aggregated and displayed in the Service Virtualization Management graphs and charts.
- Removing Stats After - the duration for which raw statistics data is stored.
Modify the settings
You can configure how statistics are recorded and stored on the Service Virtualization Server, and how they are displayed in Service Virtualization Management.
- Open the Service Virtualization Server configuration file (HP.SV.StandaloneServer.exe.config) on the Server machine, located in the
bindirectory of the server installation folder. -
Under Server Statistics, edit the following keys:
<add key="Server.Statistics.SamplingInterval" value="00:00:01" />where
SamplingIntervalis the frequency with which data is recorded.Default value = 1 second
<add key="Server.Statistics.WritingInterval" value="00:01:00" />where
WritingIntervalis the frequency with which the collected data is aggregated and displayed in the Service Virtualization Management graphs and charts.Default value = 1 minute
<add key="Server.Statistics.MaxAge" value="1.0:00:00" />where
MaxAgeis the duration for which raw statistics data is stored.Default value = 1 day
By default, service statistics are maintained for each virtual service deployed on the Service Virtualization Server until the service is undeployed. If you want to keep the statistics, you can configure the Service Virtualization Server to preserve them. This can provide you with more information for analyzing the usage of your virtual services.
-
Open the Service Virtualization Server configuration file, located in the Server installation folder. By default:
C:\Program Files\Micro Focus\Service Virtualization Server\Server\bin\HP.SV.StandaloneServer.exe.config
-
Under the appSettings node, modify the following:
-
set the following key to "true":
<add key="DurableReports" value="false" /> -
By default, the Server is configured to delete service statistics from the database after 32 days. To maintain service statistics for a longer period of time, change the value in this key:
<add key="Server.ServiceStatistics.MaxAge" value="32.0:00:00" />
-
Add histograms to statistics
Available in versions: SV 2022 R1 and later
Service Virtualization collects histograms of response time to help you interpret the data to see if there were outliers and how frequently they occurred. Adding histograms to service statistics enhances the granularity of performance test simulation and analysis.
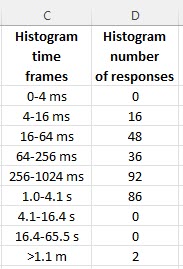
Histograms are available in the Excel export file from the following columns:
-
Histogram time frames. Contains the following values that represent the response time ranges of the histogram: 0-4 ms; 4-16 ms; 16-64 ms; 64-256 ms; 256-1024 ms; 1.0-4.1 s; 4.1-16.4 s; 16.4-65.5 s; >1.1 m.
-
Histogram number of responses. Contains the a value that represents the number of responses in each time range.
Example: This example histogram shows that most requests (92) took 256-1024 milliseconds to process. Additionally, two requests took over a minute to process, which is very slow and should be investigated further.
If you select a less granular way to aggregate data in an Excel export (for example, 15 mins), the histograms are summed up over the selected period of time across the respective ranges.