The contents of the Captured Data pane differ depending on the level you select in the Run Results tree in the left pane.
-
Start, End. General information about the Start and End activities.
-
Test Flow/Loop. Information about the loop to which the test steps belong, such as Test Flow.
-
<Step Name>. Captured data from the selected step.
-
For service type activities, this level shows the Request and Response data for the operation or method.
-
For the Report Message activity, this level displays the custom message defined in the activity's properties.
-
-
Checkpoints. Data about the checkpoints such as the Expected and Actual values, the method of evaluation (Equals, Does Not Equal) and status.
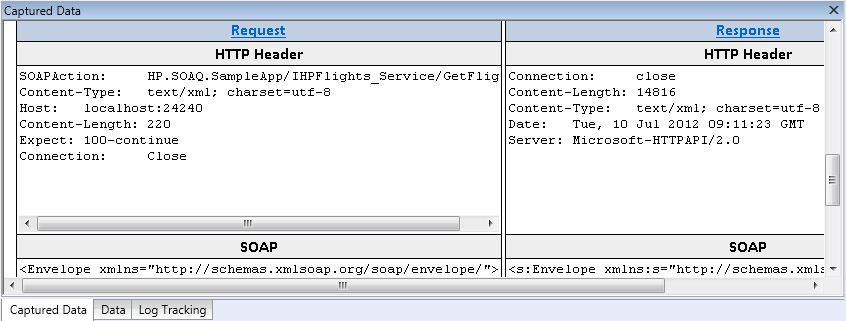
The <Step Name> level contains a table showing the request and response messages. The table shows both the HTTP header and message body. Clicking on the Request or Response link in the table header, opens the SOAP in a separate browser window.
The following example shows the Request and Response captured data for the GetFlights operation from the sample Web Service.
If you parameterized or applied data driving to an activity's properties, the viewer lists the actual values used during the test run, per iteration.
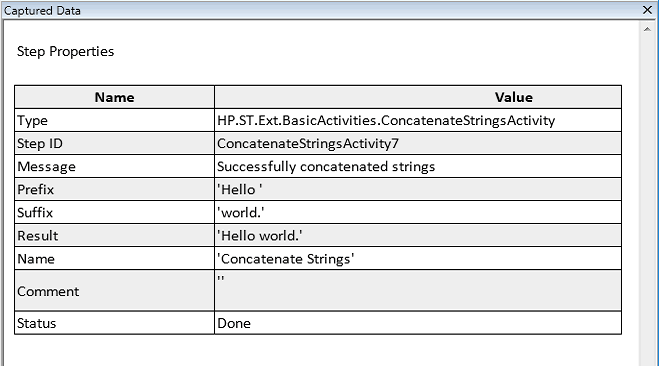
For built-in activities, the Step Properties table shows the values used during the test run.
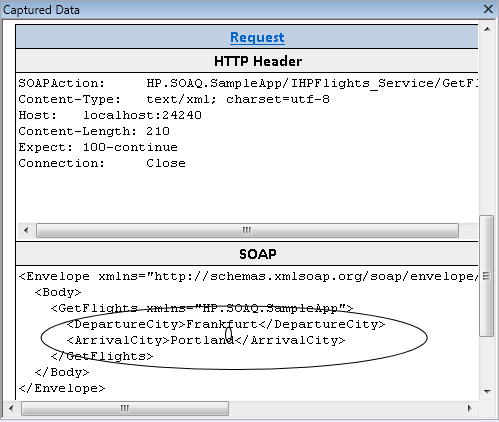
For service requests, you can observe the actual values in the Request/Response table.
When you select the Checkpoints node in the left pane, the Captured Data pane provides a list of the checkpoints, their expected values, and actual results. In the case of a checkpoint in the form of an array, the Captured Data pane provides a link to a checkpoint report.
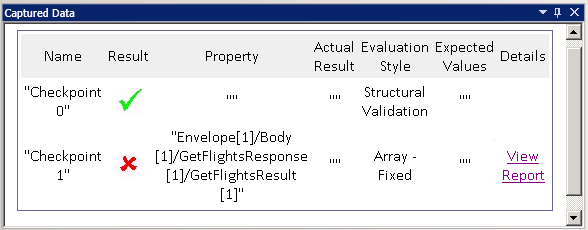
The checkpoint report opens in a separate browser window and provides details about the checkpoints in each of the array elements. You can expand each checkpoint to see what its expected and actual values were.

To view this table properly, you should enable active content in your browser in the following way:
-
In Internet Explorer, select Tools > Options.
-
Select the Advanced tab.
-
Enable the option Allow active content to run in files on My Computer in the Security section.
-
Click OK and close the browser.
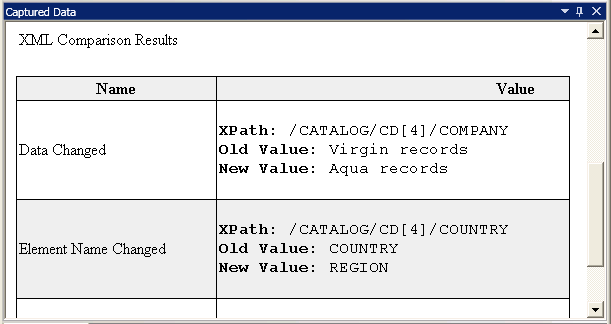
The Compare XML activity provides its results in the Captured Data pane. It indicates the changes in the XML, such as data changed or which element names changed.
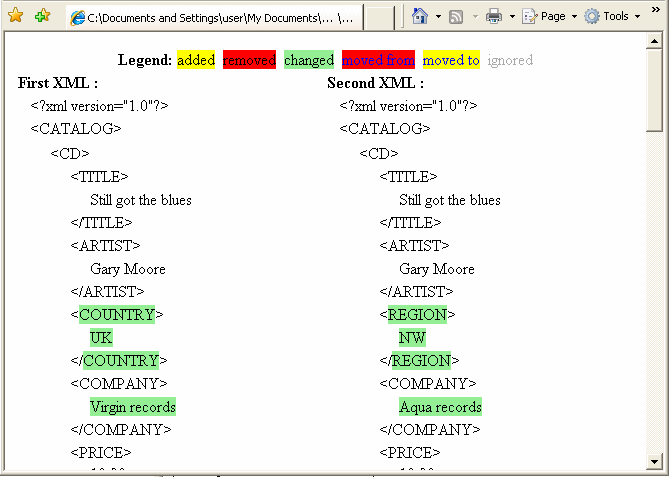
In the upper part of the Captured Data pane, click the link Report File link to open the complete comparison report in an external browser.
The XML to String and JSON to String steps provide their results in the Captured Data pane. The Step Properties table shows the resulting strings for the OutputString entry.
The Captured Data pane also shows custom messages that you sent to the output using the Report function in an event handler.
For example, add the following code to your test to print the Test Cycle value as CYCLE_JULY_2020_B in your run results:
this.ConcatenateStringsActivity5.Report("Test Cycle","CYCLE_JULY_2020_B");


