Share this page


Debug Test Object Operation dialog box
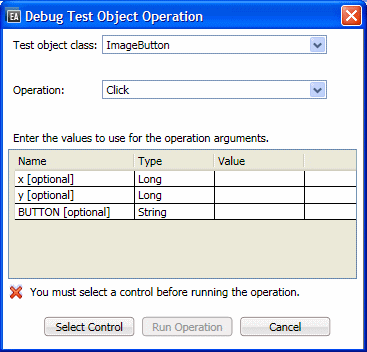
This dialog box enables you to run your test object operations from within Extensibility Accelerator, so that you can test and debug your JavaScript implementation functions.
| To access | Do one of the following:
|
| Important information | Make sure that you select the relevant control in the application before you run the operation. |
| Relevant tasks | |
| See also |
 button in the operation list toolbar.
 User interface elements are described below (unlabeled elements are shown in angle brackets):
UI Elements | Description |
|---|---|
| Test object class | The test object class of the operation that you want to run. |
| Operation | The test object operation that you want to run. |
| <operation arguments> | The arguments for the operation. Includes the following for each argument: Name. The name of the argument and whether it is optional. (Read only) Type. The type of value the operation expects for this argument. (Read only) Value. The value to use for the argument when running the operation. You must enter values for all mandatory arguments. |
| Select Control | Highlights all of the controls that match the test object class' mapping rules in all open Web applications, and enables you to select the control on which you want to run the operation. Available when: A Test object class is selected in the dialog box. |
| Run Operation | Runs the operation on the selected control, calling the JavaScript implementation that you designed. Available when: A control is selected in the application. |
| Cancel | Close this dialog box without running the operation. |