Stage 6: Test and debug the support you designed for the test object operations
Using the Debug Test Operation option, you can test and debug the implementation you designed for the operation without deploying the toolkit support set to UFT One. Extensibility Accelerator runs your JavaScript functions on the control just as UFT One would. While your JavaScript function runs, you can debug it in the browser.
Extensibility Accelerator 2022 or later: If you are running on Google Chrome, you can press F12 to open DevTools and use it to debug your functions.
If you are running on Microsoft Internet Explorer, you can debug your JavaScript functions as you would in a regular Microsoft Visual Studio JavaScript debugging session.
Prepare for testing the operations
Enable script debugging in your Internet Explorer browser.
For example: In Internet Explorer 7.0, select Tools > Internet Options. In the Advanced tab, clear the Disable script debugging options in the Browsing group. (You must close and reopen the browser after making changes to these options.)
Run the sample application in Internet Explorer. (Make sure to allow blocked content).
In Extensibility Accelerator, open the Output window (Debug > Windows > Output). If necessary, right-click in the window and select Clear All.
Select the GoToAuthorPage test object operation for testing
In the Operations tab in the test object designer, select the GoToAuthorPage operation and click the Debug Operation button
 in the Operations toolbar.
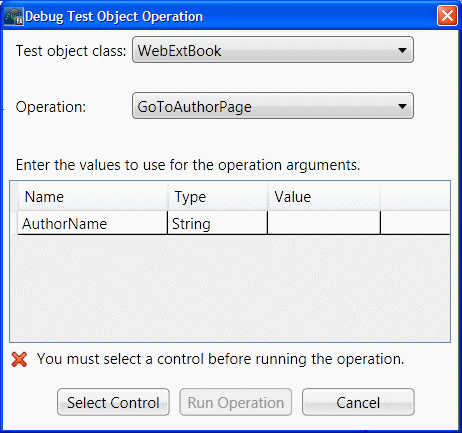
The Debug Test Object Operation dialog box opens, with the WebExtBook test object class and the GoToAuthorPage operation selected.

Select the Book control as the control on which to run the operation
Click Select Control.
Extensibility Accelerator is hidden, the Book control is highlighted in the browser, and a Cancel button is displayed at the top of the screen. (This might take a moment.)
Click the highlighted Book control.
The Debug Test Object Operation dialog box comes back into focus.
Enter the argument to use for the operation
In the argument value table, in the cell for the AuthorName value, enter Jane Doe.
Run the operation
Click Run Operation.
Extensibility Accelerator runs the GoToAuthorPage operation with the argument "Jane Doe".
The sample application opens to the JaneDoe.htm page.
In the Output window, you can see the _util.Logline and _util.Report functions that are called during this process.
Note: In this step, you tested the function using a valid value for the argument. If you use an incorrect author name, the JavaScript function throws an exception and Extensibility Accelerator displays an error message. When you run the operation in a UFT One run session, the exception results in a run-time error message, displaying the string provided by the exception.
Run an operation with a breakpoint
Run the GoToUsedBooksPage operation with a breakpoint in the function:
In the browser, click Back to sample.
In the
WebExtBook.jsfile in the JavaScript editor, insert a breakpoint by clicking on the left margin at the first line of code in the GoToUsedBooksPage function.In the Class View, right-click the GoToUsedBooksPage operation and select Debug to open the Debug Test Object Operation dialog box.
Click Run Operation.
Extensibility Accelerator runs the GoToUsedBooksPage function and stops at the breakpoint.
Many debugging options are now available in the Debug toolbar and menu. You can use Step Into, Continue, or Stop Debugging to complete this session.
Test the Select method
Use the tools that you learned in the previous steps to test the remaining test object operation you implemented.
Continue to Stage 7: Implement support for the identification properties.


