Logging and Debugging the Custom Support
This topic describes how to analyze the functionality of your JavaScript functions as you develop them.
Overview
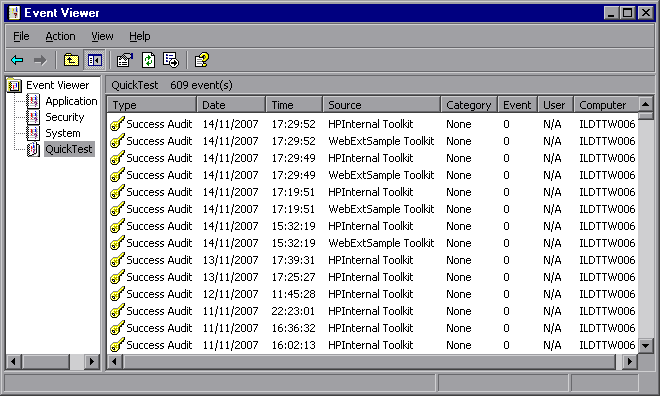
When you design the JavaScript functions for your toolkit support set, you can use the _util.LogLine method to add log messages to the Microsoft Windows event log. When OpenText Functional Testing runs a test or component using the support you designed, you can view these messages in the Event Viewer.
When you test the toolkit support set that you designed, you can debug your JavaScript files like you would debug any other JavaScript file, using the Microsoft Script Debugger or the Microsoft Visual Studio debugger.
Using the Microsoft Windows Event Log
You can use the _util.LogLine method in your JavaScript functions to add messages to the Microsoft Windows event log.
You provide the log message text and the level of severity for the log entry and, optionally, an ID and a category number. OpenText Functional Testing adds the toolkit name and a time and date stamp to the information that you provide, and adds the entry to the event log.
In addition, while recognizing objects supported by Web Add-in Extensibility and performing tests on them, OpenText Functional Testing also writes log and error messages to the event log.
To view the event log and analyze the performance of your toolkit support set, open the Event Viewer (in Windows XP and Windows 2000, select Start > Settings > Control Panel > Administrative Tools > Computer Management, expand the Event Viewer node in the Computer Management tree) and select the OpenText Functional Testing node. Double-click a specific log entry to see its text.

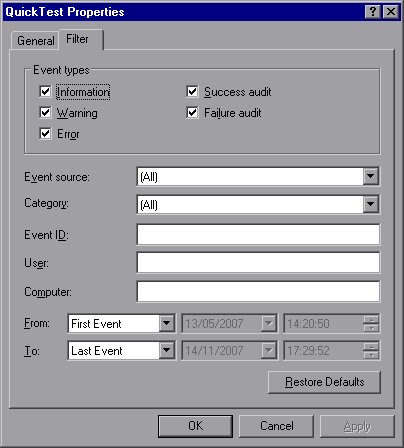
You can filter the log messages displayed in the Event Viewer according to severity and other message fields. In the Computer Management toolbar, select View > Filter. For more information, see the Event Viewer Help (select Action > Help in the Event Viewer).

Debugging Your JavaScript Files (Internet Explorer Only)
You can use the Microsoft Script Debugger or the Microsoft Visual Studio debugger to debug the JavaScript files that you write for your toolkit support set.
To enable debugging you must clear the Disable script debugging (Internet Explorer) and Disable script debugging (other) options in the Internet Explorer advanced options (Tools > Internet Options > Advanced). After you change this option, you need to restart Internet Explorer for the change to take effect.
If you want the Just-In-Time debugger to list the Microsoft Visual Studio debugger as one of the available debuggers, you need to select the Script option in the Visual Studio Options dialog box (Visual Studio > Tools > Options > Debugging > Just-In-Time).
After these debugging options are enabled, you can use all standard methods to debug your JavaScript functions. For example:
You can attach to the Internet Explorer process and put breakpoints in your functions.
You can include a
debugger;statement in your JavaScript function, to launch the Just-In-Time debugger when the function runs.You can use the Just-In-Time debugger when an exception occurs that causes it to open.


