
Share this page


Timeline view
Use the timeline to track and analyze a release's progress and quality.
Overview
The timeline displays features, epics, and other backlog items in a Gantt chart.
Visual representation of the item phases helps you analyze the current release by identifying the following:
- Long phases that may imply delays or bottlenecks.
- Phase slowdown in relation to its average cycle time.
- Repeated phases that may imply rework.
- Waste time that may imply waiting, unnecessary motions, over-processing, or any other waste defined by your process team.
To view the timeline:
-
Open the Backlog module
 .
. -
Select the Features, Epics, or Backlog items tab.
-
Open the View Type menu and select Grid View
 or Slim Grid View
  .
. -
Click the Show Timeline button
 .
.
Note: You can use the timeline API to retrieve timeline information, such as Phase instance, Start time, End time, Cycle time, and Waste. For details, see Public resources.

Timeline bars
In the timeline view, the bars represent items in phases between the New and Done metaphases, not inclusive. This means that an item's timeline starts when the item enters the In Progress metaphase, and ends when the item reaches the Done metaphase. The New and Done metaphases are not represented in the timeline.
Tip: The bars are divided into sections that represent the item's phases. Hover over a section of a bar to view more details, such as the phase start and end date, waste time, and the item's cycle time for that phase.
Timeline bars are constructed as follows.
| Bars | Details |
|---|---|
| Color |
The bar colors represent an item's phases between the New and Done metaphases, not inclusive. The colors reflect phases configured for the item workflow, and may be different depending on an item type. If an item's phase is repeated, the phase bar is marked with diagonal stripes additionally to the phase color. Tip: Click the Legend button to view a legend for the colors and icons in the timeline. For details, see Timeline legend. |
| Underline for waste |
If waste tracking for an item type is configured, the waste time is represented by a line under the item bars whose phases are associated with waste. For details, see Track waste.
|
| Predicted end date |
A flag indicates the feature's predicted end time. A color dot in the flag indicates if the feature is on track to end by its assigned milestone, or whether it's at risk to miss the milestone.
The prediction flag is displayed only after a feature has entered the In Progress metaphase. For more details, see Predictive analytics. |
| Slow phase |
The Slow phase The phase slowdown value is based on the average phase time for work items that were done in previous releases. For example, if an item remains in the same phase for more than 100% of the phase average time, a Slow phase icon is displayed in the timeline. Note:
Hover over the section of the bar marked as Slow phase to view the percentage of phase slowdown above the average item's phase time. |
| Position and length |
The bars' position represents the following: Start point: The date on which an item moved into a starting phase of the In Progress metaphase, for example phase Functional Design. End point: The date on which an item moved into a starting phase of the Done metaphase. The bar's length is determined by the time an item spent in all the phases between the New and Done metaphases. Note: The timeline displays the calendar start and end dates, while the Cycle time and Waste fields exclude the non-working days. |

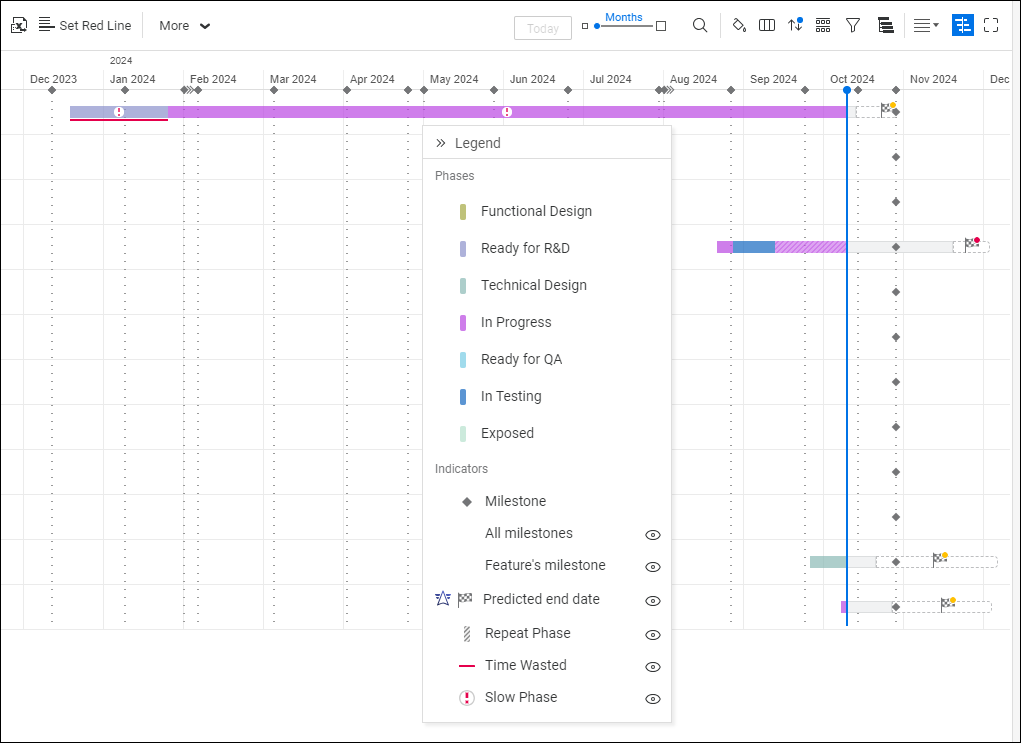
Timeline legend
The timeline legend displays colors that represent an item's phases between the New and Done metaphases, and a representation of waste time.
The legend colors reflect phases configured for the item workflow, and may be different depending on an item type.
-
Drag and drop the legend within the timeline area.
-
The Feature's milestone indicator shows you the milestone of each feature on the feature's progress bar, to help you see if the feature will be done on time. The All milestone indicator shows milestones at the top of the timeline view.
-
You can show or hide different indicators from the timeline, using the eye icon
 . For example, if you prefer to not see all milestones but only feature milestones, click the eye next to Indicators > All milestones to hide them from the view. This can help you focus on areas that are more relevant to your work.
Note:
- In the features timeline, the legend relates to features only. If features are grouped by epics, hover over an epic's bar in the timeline to view the epic's phase or other details. You can also expand an epic to view the bars for its features in the timeline.
- In the backlog items' timeline, the legend provides phase colors for each item type separately.
Milestones and the current date
Milestones and the current date are displayed as vertical lines along the timeline.
Click the Today button to jump to the current date.
| Vertical line type | Description |
|---|---|
| Solid line |
Represents the current date.
|
| Dotted line |
Represents a milestone. Hover over a line to display the milestone details. The milestone types are distinguished by the diamonds at the top of the lines:
|
Note: By default, the timeline displays only items that are related to a specific release. In the features grid, you can display all the items by clicking Show also indirect features. To revert to the original view, click Show only direct features. For details, see Related items.
Timeline actions
You can perform the following actions in the timeline area.
| Action | Method |
|---|---|
| Zoom in or out of timescale |
Timescale slider or Ctrl + mouse wheel. |
| Display item details, such as phase, start and end date, cycle time, and waste (if configured) |
Hover over the timeline bar. |
| Display milestone details |
Hover over a milestone line. |
| Resize the timeline |
Click and drag the divider between the grid and the timeline. |
 Next steps:


