Replay Summary pane

This pane provides summarized replay results and links to script replay details.

To access

Use one of the following:

  • In the Solution Explorer, double-click Replay Summary
  • Click the View summary link in the Output Pane
Important

To enable transaction breakdown data, select Tools > Options > Scripting > Replay > Collect replay statistics.

Note: Enabling the Collect replay statistics option will affect replay performance.

See Also

User interface elements are described below (unlabeled elements are shown in angle brackets).

The actual information included in the Replay Summary report varies, depending on the protocol.

UI Element Description

Results Dashboard

Displays basic script information including:

  • Script name
  • Replay Status: Displays a replay status of the script as either Script passed or Script failed.

  • Elapsed time: Total time passed during script replay.

  • Started at. Starting time of the script replay.

  • Ended at. Ending time of the script replay.

  • Think time. Total duration of Think timeClosed Span of time inserted into a script to simulate a user's pausing before moving on to the next step in a business process. passed during script replay.

  • Wasted time. Total duration of Wasted timeClosed Time spent on activities whose purpose is to support test analysis, but would never be performed by a browser user. passed during script replay.

  • Save HAR file. For Web HTTP/HTML and SAP - Web scripts only. Saves the traffic information to a HAR file.
  • Export to PDF. Saves the current replay summary to a PDF file.

  • Open NV Insights Report. For details, see NV Insights Report.
  • Select result scope: (Available if you enable the collection of replay statistics.) Enables you to select a specific iteration result set or to display averages of all iterations.

Select result scope

Lets you set the scope of the results shown in the Script Performance table (below): Average, Init, End, or per iteration.

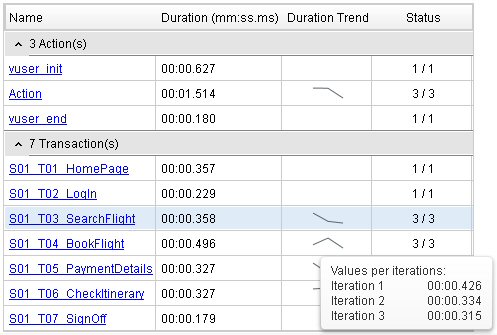
<Script Performance>

A list of the script's actions and transactions with basic information. Click on an action or transaction to show or hide its details below the table (only available if you enable the collection of replay statistics) .

  • Name: The name of the action or transaction.
  • Duration: When the scope is a single iteration, the time displayed is the duration of the transaction. When the scope is an average, the time displayed is the average duration of all iterations.
  • Duration Trend: A Sparkline representation of values over all iterations (for multiple iterations only).

  • Status: The number of iterations with a status of Passed/Total iterations.

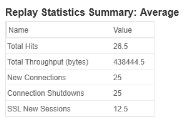
Replay Statistics Summary <scope>

A list of script statistics and their values after replay, per scope (selectable from the masthead: Average, a specific action, or a specific iteration). For example:

Note: Requires that you enable Collect replay statistics from Tools > Scripting > Replay.

Connection statistics

Details

A collection of statistics per action or transaction, as per the selected scope (the script average, a specific action, or a specific iteration).

Note: These statistics are available for Web - HTTP/HTML and SAP - Web protocol scripts only.

  • Count: The number (or average number for multiple iterations) of connections to the server per domain.

  • Hit Count: The number (or average number for multiple iterations) of files requested from the server.
  • Hit Count %: The amount of each hits per item (or average for multiple iterations) as a percentage of the total hits to all items. Expand the node to view all of the items.
  • Hit Count % Trend: A Sparkline representation of the hit count values over all iterations.
  • Size: The size (or average size for multiple iterations) of the data returned from the server per domain.

  • Size %: The percentage (or average percentage for multiple iterations) of data size returned from the server per domain, of the total returned data.

  • Size % Trend: A Sparkline representation of values over all iterations.


Responses per content-type

Details

Content-type statistics per transaction or action for the current scope (the script average, a specific action, or a specific iteration).

Note: These statistics are available for Web - HTTP/HTML and SAP - Web protocol scripts only.

  • Responses per content-type: A list of the content type returned from the server, for example, an image, a JavaScript, a CSS (expand to view list).

  • Count: The number (or average number for multiple iterations) of connections per content type.

  • Count %: The percentage (or average percentage for multiple iterations) of connections to the server content type from the total number of connections.

  • Count % Trend: A Sparkline representation of the count values over all iterations.

  • Size: The size (or average size for multiple iterations) of the data returned from the server per content type.

  • Size %: The percentage (or average percentage for multiple iterations) of data returned from the server for each content type from the total returned data.

  • Size % Trend: A Sparkline representation of values of the data size per content type over all iterations.

Responses per HTTP status

Details

HTTP Status statistics per action or transaction for the current scope (the script average, a specific action, or a specific iteration).

Note: These statistics are available for Web - HTTP/HTML and SAP - Web protocol scripts only.

  • Responses per HTTP Status: List of the HTTP status codes returned .

  • Count: The number (or average number for multiple iterations) of connections per HTTP status code.

  • Count %: The percentage (or average percentage for multiple iterations) of connections per HTTP status code from the whole action or transaction.

  • Size % Trend: A Sparkline representation of values over all iterations.

<Modify Runtime Settings>

Enables you to access Runtime Settings for your active script.

<Modify Content Check Rules>

VuGen's ContentCheck mechanism enables you to detect all types of errors sent by the web server.

For details, see Internet Protocol > ContentCheck view in the runtime settings.