Share this page


Manage analysis menus
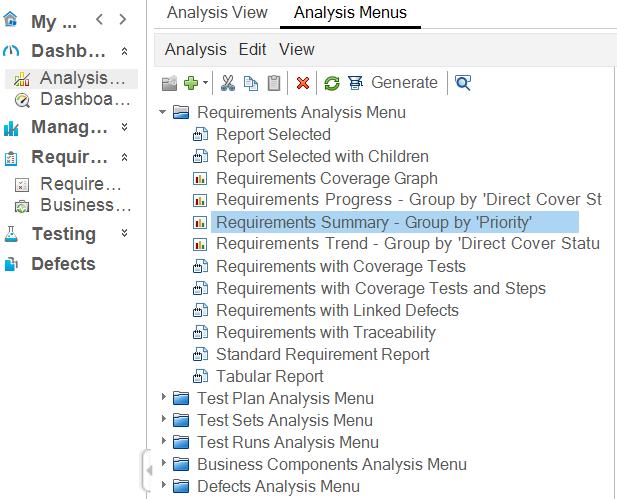
If you have the Manage Analysis Menus permission, you can add, configure, and view graphs and project reports in Dashboard > Analysis View > Analysis Menus.
These graphs and project reports are ready for use from within entity modules.
For example, if you create a requirement summary graph, named Requirements Summary - Group by Priority, in Analysis Menus, users can directly generate the graph from within the Requirements module > Analysis menu.
For details about how to add and configure graphs, see Entity graphs.
For details about how to create and configure project reports, see Create and configure project reports.

 See also: