Viewing and Analyzing Test Results
ALM provides a number of features that enable you to view and analyze the results of your tests.
You can also use ALM reports and graphs to further analyze your test results. For details, see Analyzing ALM Data.
Viewing Test Results in the Test Runs Module
You can view results for a test in the Test Runs module. You can use the grid to compare the results of recent test runs with previous test runs.
In the below exercise, you will learn how to view test run information in the Test Runs module.
Viewing Functional Test Set Results in the Test Set Runs Tab
If you are using ALM Edition with Lab Management enabled, you can view the results of your Functional test set runs in the Test Set Runs tab.
To view test set results in the Test Set Runs tab:
-
Make sure the Test Runs module is displayed.
On the ALM sidebar, under Testing, select Test Runs.
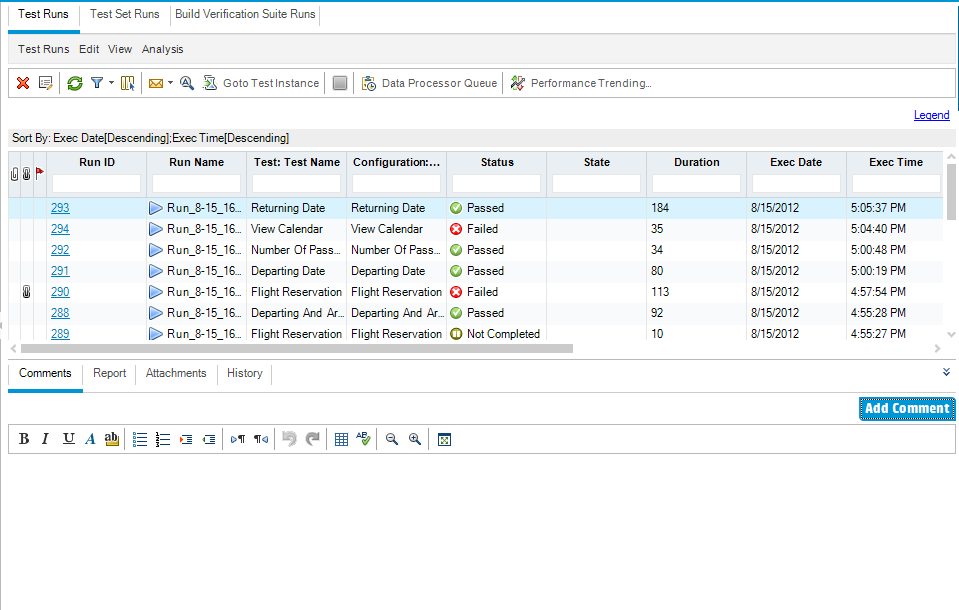
-
View detailed test results from the Test Set Run Details dialog box.
Click the Test Set Runs tab. Select the Mercury Tours Site test set run in the grid and click the Test Set Run Details button. The Test Set Run Details dialog box opens, containing details about the test set run.
-
Close the Test Set Run Details dialog box.
Click the Close button.
-
View test run information in the Execution Report page.
Select the Mercury Tours Site test run and click the Show Report button. The Execution Report page opens. The Execution Report page displays information about the overall test set run and detailed information about each test instance run.
Viewing Test Results in the Test Runs Tab
In this exercise, you view the results of individual test instance runs.
To view test results in the Test Runs tab:
-
Make sure the Test Runs module is displayed.
On the ALM sidebar, under Testing, select Test Runs.

-
View detailed test results from the Test Run Details dialog box.
Make sure the Test Runs tab is displayed. Select the American Express test run and click the Test Run Details button. The Test Run Details dialog box opens.
-
View other test run information in the Test Run Details dialog box.
- Click Report to display results and test step details of the run.
- Click Linked Defects to list the defects linked to the run.
- Click History to list the changes made to the run.
-
Close the Test Set Run Details dialog box.
Click the Close button.
Viewing Test Results in the Test Instance Properties Dialog Box
You can view results for a test in the Test Instance Properties dialog box. This includes details of a test’s runs, attachments, linked defects, and history.
To view test results in the Test Instance Properties dialog box:
-
Make sure the Test Lab module is displayed.
On the ALM sidebar, under Testing, select Test Lab.
-
Make sure the Cycle 1 - New Features test set folder is displayed.
-
In the test set tree, expand the Cycle 1 - New Features test set folder under Service Pack 1. Select the Mercury Tours Site test set.
-
Click the Execution Grid tab.
-
-
Select American Express in the Execution Grid.
In the Execution Grid tab, select American Express.
-
View detailed test results from the Test Instance Details dialog box.
Click the Test Instance Details button. The Test Instance Details dialog box opens.
-
View test run information.
Click Runs. The run details are displayed.
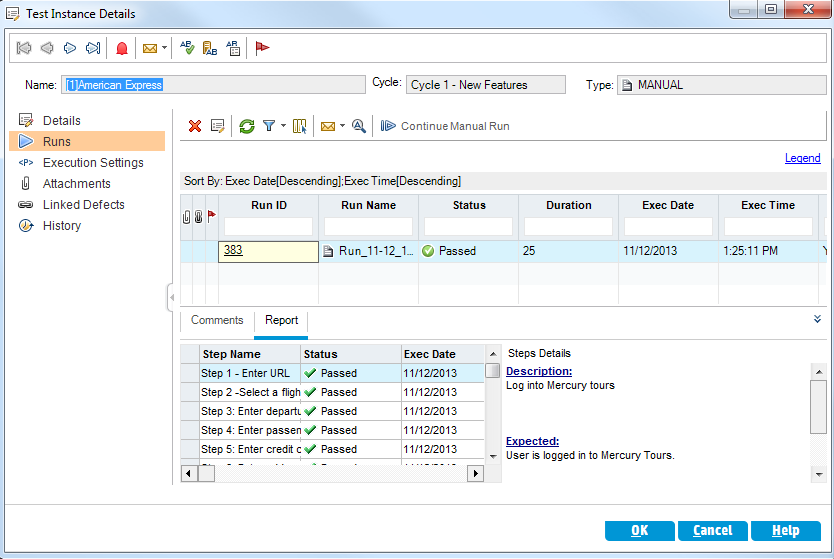
-
View other test run information in the Test Instance Details dialog box.
-
Click Execution Settings to view parameters used to run the instance. Note that any changes that you make are implemented in the next test run.
-
Click Linked Defects. This view lists the defects linked to the currently selected test instance. You can view, add, and remove defect links.
-
Click History to view a list of changes made to the test run fields.
-
-
Close the Test Instance Details dialog box.
Click the Close button.
Viewing Test Coverage
You previously saw how you can use the Coverage Analysis view to analyze the breakdown of child requirements according to their tests coverage (see Analyzing Coverage).
In this exercise, you will learn how to filter the tests included in the coverage analysis by cycle.
To view test coverage:
-
Display the Coverage Analysis view in the Requirements module.
-
On the ALM sidebar, under Requirements, select Requirements.
- Choose View > Coverage Analysis. The Coverage Analysis view is displayed.
-
-
Filter the coverage analysis by cycle.
-
On the upper-right side of the window, click the Settings button. The Analysis Settings dialog box opens.
-
Select Execution Analysis. Click the arrow. In the releases tree, expand the release folder Service Packs and the release Service Pack 1. Select the Cycle 1 - New Features check box and click OK.
-
Click OK to close the Analysis Settings dialog box.
-
Expand the Payments requirement. In the Coverage Analysis column, you can see that the requirement has failed. This is because the Credit Cards test that covers the requirement failed.
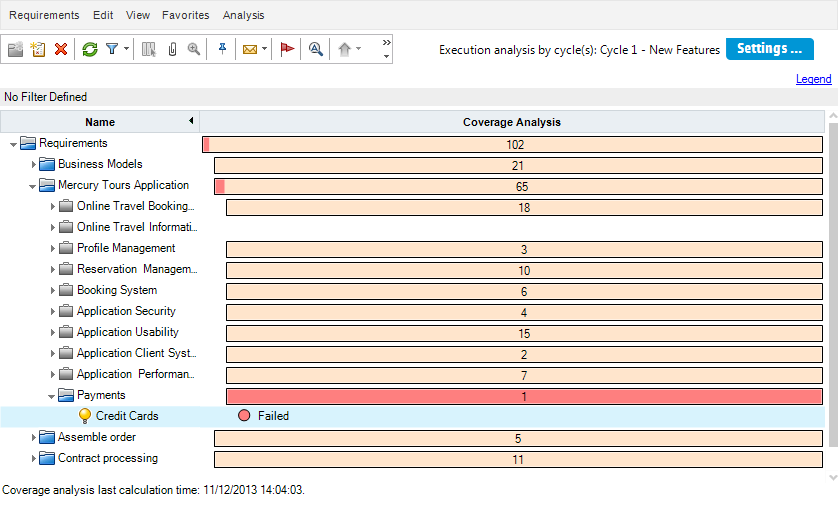
-
-
Display test coverage details for the Credit Cards requirement.
-
Right-click the Credit Cards requirement, and choose Coverage Analysis. The Coverage Analysis dialog box opens.
-
Click the Show Test Coverage link to extend the Coverage Analysis dialog box and display the Test Coverage Chart.
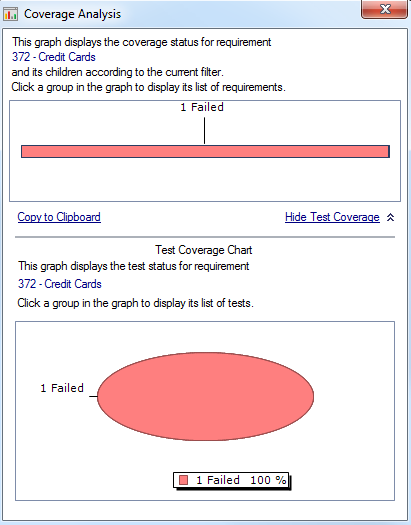
-
This pie chart graphically displays the full test coverage for the requirement, grouped according to test status.
-
Click the pie chart to open the Test Coverage dialog box.
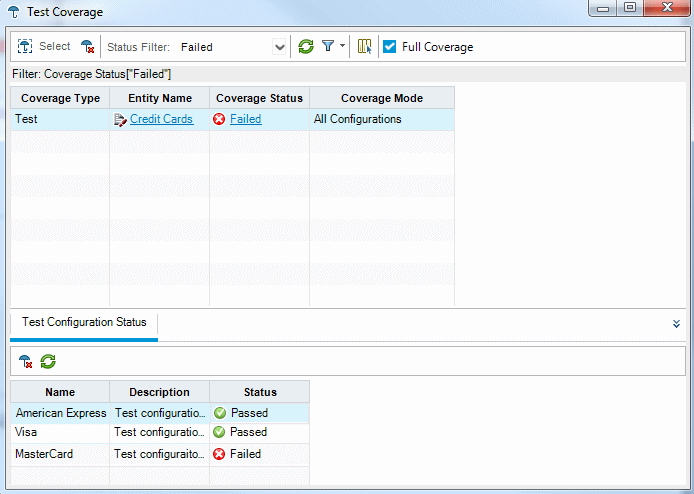
The dialog box shows the failed test together with the test run status of each test configuration.
- Close the Test Coverage dialog box.
-
-
Close the Coverage Analysis dialog box.
Click the Close button.
Viewing Coverage Progress
You were previously introduced to the Progress tab in the Releases module (see View releases and cycles).
In this exercise, you will view the graphs and statistics that now reflect the results of tests you ran in previous exercises.
To view coverage progress:
-
Display the Releases module.
On the ALM sidebar, under Management, select Releases.
-
View the effect of your test runs on the Progress tab.
In the releases tree, expand the release folder Service Packs and the release Service Pack 1. Select Cycle 1 - New Features and click the Progress tab.
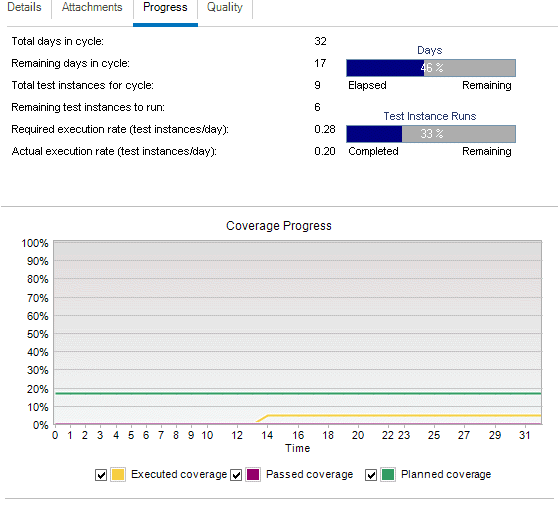
The top pane shows information such as the total and remaining days in the cycle, total test instances for the cycle, and actual and remaining test instances to run.
The bottom pane displays the Coverage Progress graph. Planned coverage indicates the percentage of tests planned to be run each day within a cycle. Executed coverage indicates the percentage of tests that ran each day within a cycle. Passed coverage indicates the percentage of tests that ran successfully each day within a cycle.


