Share this page


Chaos testing for scenarios
You can add Gremlin event scenarios to your Controller scenarios. This enables simulated attacks on your services and environments. The simulated attacks integrate chaos and stress testing into your test runs.
About chaos testing
Gremlin is a Chaos Engineering platform that can test how your system responds under stress. If you are using Gremlin in your environment, you can incorporate Gremlin attacks into your LoadRunner Professional tests. This help you determine the impact of unexpected failures on your applications.
In Gremlin, you can define virtual attacks on different technologies and components, for example, databases, web servers, CPU, or memory. After a Gremlin attack scenario has been added to your LRP scenario, in parallel an attack is launched on the system when you run the LRP scenario .
An attack generally has an impact on the regular workflow, limiting response or reducing performance. For example, the web server may work slower than usual and there may be fewer successful transactions. You can compare responses when running your LRP scenario without an attack, and running when the system is stressed.
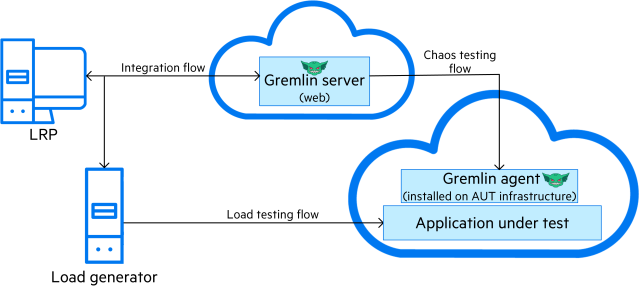
LRP uses integrated Gremlin APIs to coordinate the chaos testing. It also has a microservice component, EventsHandlerMicroservice, that is called when you add Gremlin scenarios. The microservice sends a request to Gremlin to execute the predefined scenario.
Read more about chaos engineering with LoadRunner Professional in this blog: What is Chaos Engineering?

Connect Gremlin attacks to scenarios
You connect the attack scenarios in Gremlin to your LRP scenarios, to run in parallel with the scripts.
Version update: The Gremlin icon and Disruption Events scheduling graph are included in Controller from version 2022 R1.
To incorporate Gremlin scenarios:
-
Set up and configure your Gremlin environment for the application you are testing.
-
Open the scenario. In the Controller Design tab, in the Scenario Schedule pane, click the Disruption Events
 button.
 -
In the displayed Disruption Events dialog box, click Add Event.
-
In the displayed Add Event dialog box, define the relevant API Key and Team ID to connect to the Gremlin server. Once successfully connected, a green Gremlin icon is displayed next to the Type field.
When connected, the event scenarios previously defined in Gremlin are added to the events list. The list includes attack and technology type, and the email of the event creator.
-
Select the events you want to use, and click Add.
Tip: To filter the events list:
-
Search events by name.
-
Filter by Attack Type or Technology Type.
-
-
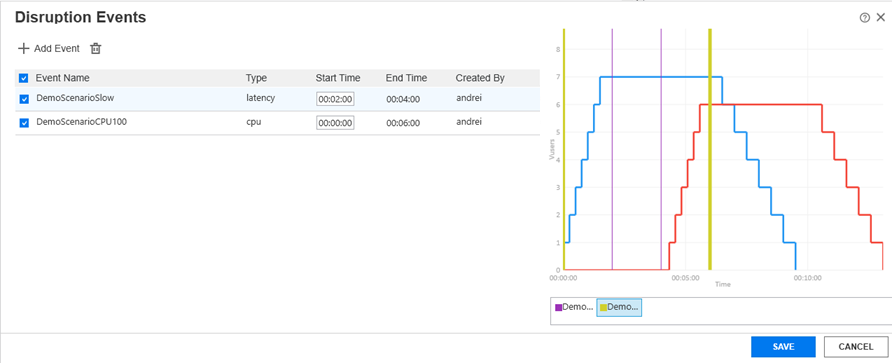
The selected event scenarios are displayed in the Disruption Events dialog box.
-
Select the events you want to run for the current scenario, and define the required start time for each event.
The start time is relative to the overall test scenario start time. The end time automatically adjusts when you modify the start time, based on the length of the event.
-
The scheduling graph shows where each selected event is due to start and end, against the global Vusers schedule for the Controller scenario.
Select an event from the legend to bold the event lines in the graph.
Note: If the end time for the disruption event is after the load test scenario run time, then the event is forcefully stopped when the scenario ends.
-
-
Click Save.
-
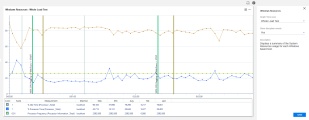
During the scenario run, the actual start and end times for each event are displayed as bars on the scenario graphs, enabling you to see how the chaos event impacts the monitored machine.
Click on the bars to highlight them and display the event name.
Note:
-
Event bars on the scenario graphs is supported from version 2022 R2.
-
In the graph settings, you can configure to display or hide the event bars for each individual graph. You can also display or hide for all graphs in the global graph settings.
You can view notifications for when every disruption event starts and stops in the Output window. For details, see the Output window. The Output window also reports if there is any error with the event run.
-
-
After the scenario run, view the results in Analysis. The Chaos Events graph is displayed automatically, showing data for the disruption events.
The event start and end times are also shown on the Scenario Schedule in the Summary Report.

 See also: