
Share this page


Integration with Datadog
You can configure Controller to push real-time metrics and data from scenario runs to Datadog. In Datadog, you can install an optional dashboard to view the data in pre-configured widgets.
Tip: The integration with Datadog is bi-directional. OpenText Professional Performance Engineering can also receive monitoring metrics collected by Datadog. The metrics are displayed in Controller and Analysis graphs. For details, see Datadog monitor.
Push data to Datadog
You can configure Controller to push data to Datadog. You can choose whether to send scenario information and/or run metrics. In Datadog, the data is formatted with tags that enable you filter and aggregate the data.
To configure Controller to push data to Datadog:
- In the Controller toolbar, select Tools > External metrics > Datadog configuration.
- In the displayed Datadog Configuration dialog box, in the Site field, select the region defined in your Datadog account.
- In the API key field, enter the API key generated by Datadog. For details on generating an API key, see the Datadog documentation.
- Click Test Connection.
-
Once the connection is successful, select whether to send scenario information and/or run information to Datadog:
Option Details Send scenario information Send information about the scenario run, such as the start and stop time, duration, and included scripts.
Send run information Send metrics from the scenario run, such as Vuser status and transaction response times.
For details on the available metrics, see Metrics and tags.
-
If you enable Controller to send scenario information, refer to the Datadog documentation to define a pipeline job that applies tags to the scenario information.
For details on the available tags, see Metrics and tags.
-
Optionally, in Datadog, install the LoadRunner Professional Dashboard. When you run a Controller scenario, the data is displayed in dashboard widgets. For details, see LoadRunner Professional dashboard.
Once Controller has been configured to push data to Datadog, the data is pushed each time you run a scenario in Controller. To stop Controller from pushing data to Datadog, select Tools > External metrics > Datadog Configuration and click Clear to clear the fields in the dialog box.
Tip: For details on how to set up metrics and tags to filter the data, see Metrics and tags.

LoadRunner Professional dashboard
The integrations include the LoadRunner Professional dashboard, which you can install in your tool.
You can find the dashboard in the Assets section. For details on installing a dashboard, see the product's documentation.
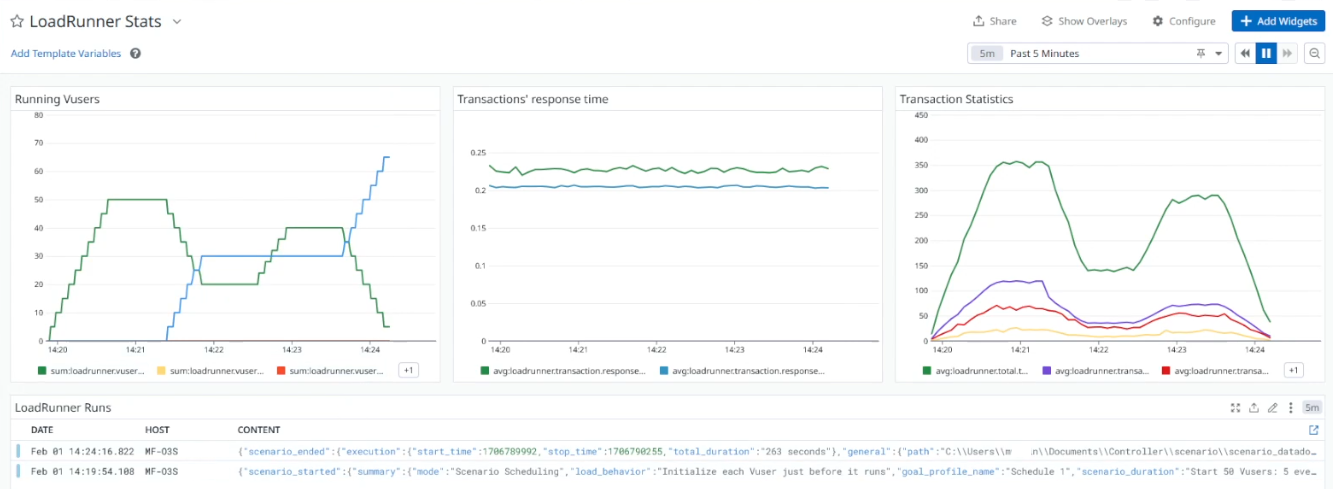
The dashboard includes widgets that display run information and scenario information (depending on the data that Controller is configured to send).
| Data | Widgets |
|---|---|
| Run information |
Graphs displaying run metrics:
|
| Scenario information | List of scenario runs. To view additional details, click an item in the list. |
You can filter and aggregate the widget data using tags. For details, see Tags.
 See also:


