Share this page


Transaction Overview
The Transaction Overview page enables you to compare transaction duration and transaction throughput under various network conditions.
In this topic:
- General analysis
- Report header
- Sidebar widgets
- View transaction details
- Change the view settings
- Filter the display
General analysis
On the Transaction Overview page, you can do the following.
-
Analyze transactions based on duration and throughput.
-
Examine the impact of different network conditions across all transactions in your test.
-
Drill down to a specific transaction to view analysis results and get recommendations on how to improve your application's performance.

Report header
The header displays the name of the test from which the NV Insights report was generated.
When you drill down into the report, the name of the specific transaction-network scenario (virtual location) combination is displayed in the header. You can expand the list to select a different network scenario or transaction (according to what is currently displayed).
Example:

Test summary information
The value for Runs indicates the total number of transactions that ran in the test multiplied by the total number of network scenarios (virtual locations). In Chart view, Runs equals the total number of bars, and in Grid view, Runs equals the total number of rows.
Example:

Sidebar widgets
The widgets in the sidebar display summary information about transaction status, network impact, and optimization. For details on the widgets, see Dashboard.
View transaction details
Hover over a transaction bar in a graph to view more details.
The following details are displayed:
| Element | Description |
|---|---|
| Summary data |
The following summary data is displayed.
|
|
Status |
The icon indicates the status of the transaction. Possible values:
For details, see Transaction status. |
| Duration | The total time in seconds it took to run the transaction. |
| Baseline |
The following baseline data is displayed:
|
| Network Impact |
The effect of the network conditions on transaction duration. For details, see Network impact. Hover over or click a piece of the donut to see the number of transaction runs in the range, and how the transactions compare to the baseline. The associated transaction runs are highlighted on the page. For transactions that ran without a baseline, the donut is displayed as empty. |
| Throughput |
The total amount of data transferred during the transaction.
|
| Go To Transaction Analysis |
Drill down to view recommendations on how to improve your application's performance and analysis results for a specific transaction run. For details about the analysis results pages, see NV Insights report. |
 Passed
  Failed
  Skipped
Change the view settings
Use the buttons in the header to configure the following view settings:
- Expand the Group by list and select whether to group the data by transaction or by network scenario (virtual location).
- Click the Chart/Grid buttons
 to switch the data display between graph or list format.
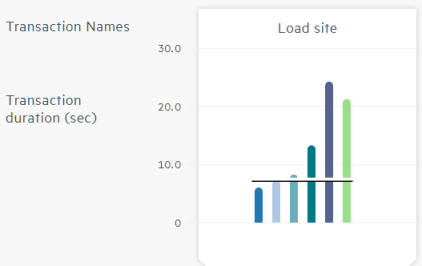
Chart view displays the data in bar charts. The bar charts display transaction time and throughput under various network conditions. Each bar in a graph represents a single test for a specific transaction-scenario combination.
- Hover over the bar of any transaction to view more details about the transaction. For details, see View transaction details.
- Click a bar of any transaction to drill down to view more details about the transaction.
| Bar chart | Description |
|---|---|
| Transaction duration (sec) |
The time (in seconds) that it took to run the transaction under each set of network conditions. The horizontal line that crosses each group represents the transaction duration for the baseline scenario for that transaction. (The actual value that is used as a baseline is different for each transaction.) Use the controls in the sidebar of the report to select the baseline scenario. Each color represents a different network scenario or transaction, depending on the view. The graph enables you to compare duration times for an individual transaction run under different network scenarios.
|
| Total throughput per transaction (KB) |
The total amount of data (in KB) transferred during the transaction, under each set of network conditions. |
Grid view enables you to see a more detailed view of the transactions.
Each row in the list represents a run of the test for a specific transaction-scenario combination.
Click any transaction (row) in any list to drill down and display pages that show more details about the transaction.
| Column | Description |
|---|---|
| Network / Transaction |
Depending whether the data is grouped by transaction or network scenario, displays one of the following:
|
| Duration | The total time in seconds between the transaction start and end. |
| Network Time | The total time in seconds between the start of network activity and the end of network activity. |
| Baseline |
The fastest iteration for each transaction when run without a virtual location (network scenario). Hover over a baseline value to see the actual baseline for that specific transaction/virtual location combination run. |
|
Total Throughput
|
The total amount of data in KB transferred during the transaction.
|
| Transaction Status |
The icon indicates the status of this transaction. For details, see Transaction status. |
| Grade |
A letter indicating the level of compliance with the best practice rules for programming websites, with A representing the highest level of compliance, and F representing the lowest level of compliance. For more details, see Optimization recommendations. |
Filter the display
Filter the displayed data by clicking the Filter button  in the header.
The following filters are available:
- Network scenario (virtual location)
- Transaction name
- Optimization grade
- Percentage of network impact
Note: For very short transactions, the time filter might show a negative value on the scale if the baseline takes longer than the transaction run.
Clear parts of the filter or the entire filter by clicking Clear or Clear All in the open filter, or by clicking the X on the Filter button.