
Share this page


When you execute a load test scenario, Vusers generate result data as they perform their transactions. The Analysis tools enable you to dissect and compare the results of the test runs. They provide graphs and reports to view and understand the data, and to analyze system performance.
Analysis tools
There are two Performance Engineering Analysis tools available, both integrate with Controller:
- OpenText Professional Performance Engineering Analysis. This is an on-premises application for gathering and presenting load test data. It is installed on a Windows machine in your network, and integrates with Controller by default. For install details, see Install components using the Setup wizard.
- OpenText Core Performance Engineering Analysis. This is part of the Performance Engineering module, providing a cloud-based solution designed for smart, scalable, high performance analysis. It analyzes and presents metrics and results from performance and load testing data, which are collected from various source models, all within a unified system. For details on setting up the integration, see OpenText Core Performance Engineering Analysis integration.
Caution: The information in this Help Center refers to the on-premises version of Analysis, unless otherwise specified.
Start Analysis
When Analysis is opened directly from Controller after executing a load test scenario, Analysis takes the latest result file and opens a new session using the results. You can open the Analysis results session manually, or set it to open automatically after the scenario run.
You can also start Analysis as an independent application.
| To open Analysis: | Steps |
|---|---|
| Automatically after scenario execution |
Select Results > Auto Load Analysis. For details, see Prepare a scenario to run. |
| Manually after scenario execution |
Options:
|
| As an independent application |
Options:
|
 on the toolbar.
Create Analysis sessions and collate data
When you run a load test scenario, Controller stores the runtime data in a result file with an .lrr extension. Analysis processes this data and generates graphs and reports.
By default, all Vuser information is stored locally on each Vuser host. After scenario execution, the results from all of the hosts are automatically collated or consolidated in the results folder.
You deactivate automatic collation by choosing Results > Auto Collate Results in Controller, and clearing the check mark adjacent to the option. To manually collate results, choose Results > Collate Results. If your results have not been collated, Analysis automatically collates the results before generating the analysis data.
When you work with Analysis, you work within an Analysis session. This session contains one or more sets of scenario results (.lrr file). Analysis stores the display information and layout settings for the active graphs in a file with an .lra extension.
Analysis database
Analysis supports 3 database types:
- Microsoft Access
- Microsoft SQL Server
- SQLite
For supported database versions, see the Support Matrix.
If your Analysis result data exceeds two gigabytes, it is recommended that you store it on an SQL server.
For details on specifying the Analysis database, see Database tab.
View results
Analysis provides the following tools to view results:
-
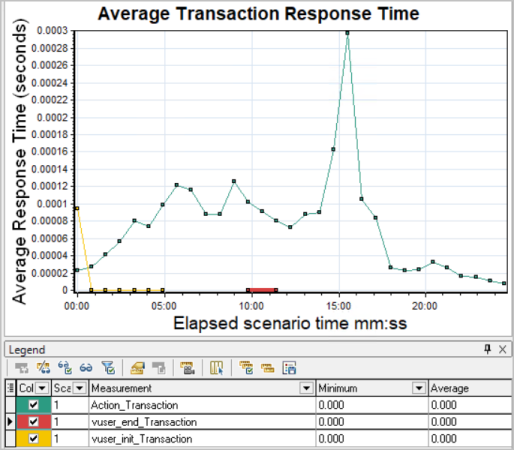
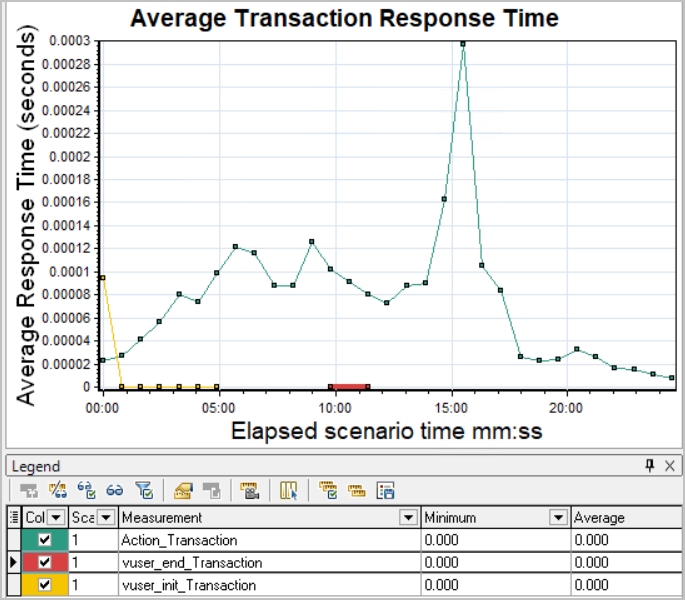
Graphs. Standard and protocol-specific graphs help you determine system performance and provide information about transactions and Vusers. You can compare multiple graphs by combining results from several load test scenarios or merging several graphs into one.
Each graph has a legend which describes the metrics in the graph. You can also filter your data and sort it by a specific field.
- Analysis graph data and raw data views. These views display the actual data used to generate the graph in a spreadsheet format. You can copy this data into external spreadsheet applications for further processing.
-
Analysis reports. This utility enables you to generate a summary of each graph. The report summarizes and displays the test's significant data in graphical and tabular format. You can generate reports based on customizable report templates.


