Run results
The Runs page provides test details, status, and run highlights for your load test.
Test run status
To access the Runs page, go to the Load tests tab, select a test, and click Runs ![]() in the sidebar. The Runs page displays a list of past runs with the status of the run.
in the sidebar. The Runs page displays a list of past runs with the status of the run.
The following table summarizes the possible values for the test status.
| Status | Description |
|---|---|
| Aborted | You stopped the test during the initialization. |
| Failed | The test has ended and one or more SLAs were broken. |
| Halted | OpenText Core Performance Engineering stopped the test due to a security limitation. |
| Passed | The test has ended without any failed transactions. |
| Running | The test is currently running. |
| Stopped | You stopped the test and no SLAs were broken. |
| System Error | OpenText Core Performance Engineering was unable to run the test due to a server error. |
The standard archiving for test run results is three months. Results older than three months are automatically archived, except for results that were set as a benchmark. To obtain archived results, submit a service request. Test run results that were restored from the archive, are available for an additional 12 months before they are archived again.
In addition, a single test is configured to manage up to a maximum 1000 test runs. When the maximum number of runs are exceeded, the oldest runs are archived for that test.
Test details and actions
The following table describes the data displayed for each test:
| Item | Description |
|---|---|
| Status | The status of your test run. For details, see Test run status. |
| Start Time | The start date and time of the test. |
| Duration | How long the test ran. |
| Vusers | The numbers of Vusers allocated to the test. |
The following table describes the actions that you can perform on your test results:
| Action | Description |
|---|---|
| Set benchmark | Click the Benchmark button to set a run as a benchmark to compare with other runs on the dashboard. |
| View Dashboard | Click the Dashboard button |
|
Generate a report |
In the Runs page, highlight a results row and click the Report button |
|
Export to a CSV |
In the Runs page, highlight a results row, click the More options button |
|
Open a single user performance report |
In the Runs page, highlight a results row, click the More options button |
| Add a note |
You can add a note to a completed test run, or to a running test after the initialization stage. To add a note, from the Runs tab click the More options button When a test run includes a note, the Note icon To edit an existing note, in the result row for the test run do one of the following:
Note: You can add a note to a test run with any status, but its duration must be greater than zero. |
| Delete a run |
In the Runs page, highlight a row (without clicking on its link), expand the More button Note:
|
Result highlights
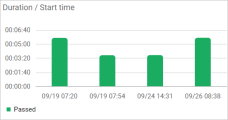
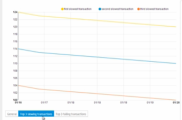
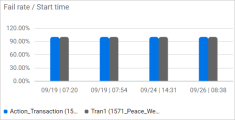
Above the list of tests, the following results highlights are displayed:
 Next steps:


