Share this page


InfluxDB and Grafana
DevWeb measurements can be reported to InfluxDB, and then visualized using dashboard tools like Grafana.
In this topic:

Storing data on InfluxDB
LoadRunner Developer can report run data to InfluxDB. You can then use a compatible open-source analytics solution, like Grafana, to visualize the received measurements (see Visualize measurements with Grafana, below).
To enable reporting to InfluxDB, you must update the local version of the config.yml configuration file.
To set up data reporting to InfluxDB:
-
Install the InfluxDB database.
Supported InfluxDB versions: InfluxDB 1.x, InfluxDB 2.0
- Open the local.config.yml file. If you have not yet created one, refer to the instructions here: LoadRunner Developer configuration
-
In the measurements section of local.config.yml, update the following parameters:
-
adapters. Define one or more database adapters, for the databases to which data will be reported:
Value Database influxDB InfluxDB 1.x influxDBV2 InfluxDB 2.0 sqlite SQLite - useProxy. Change to
trueto use the proxy settings from rts.yml to connect.
-
- In the influxDB or influxDBV2 section of local.config.yml, configure the endpoint and other parameters for the relevant database adapter.
Visualize measurements with Grafana
You can use the Grafana dashboard tool to visualize and analyze the results of your DevWeb tests.
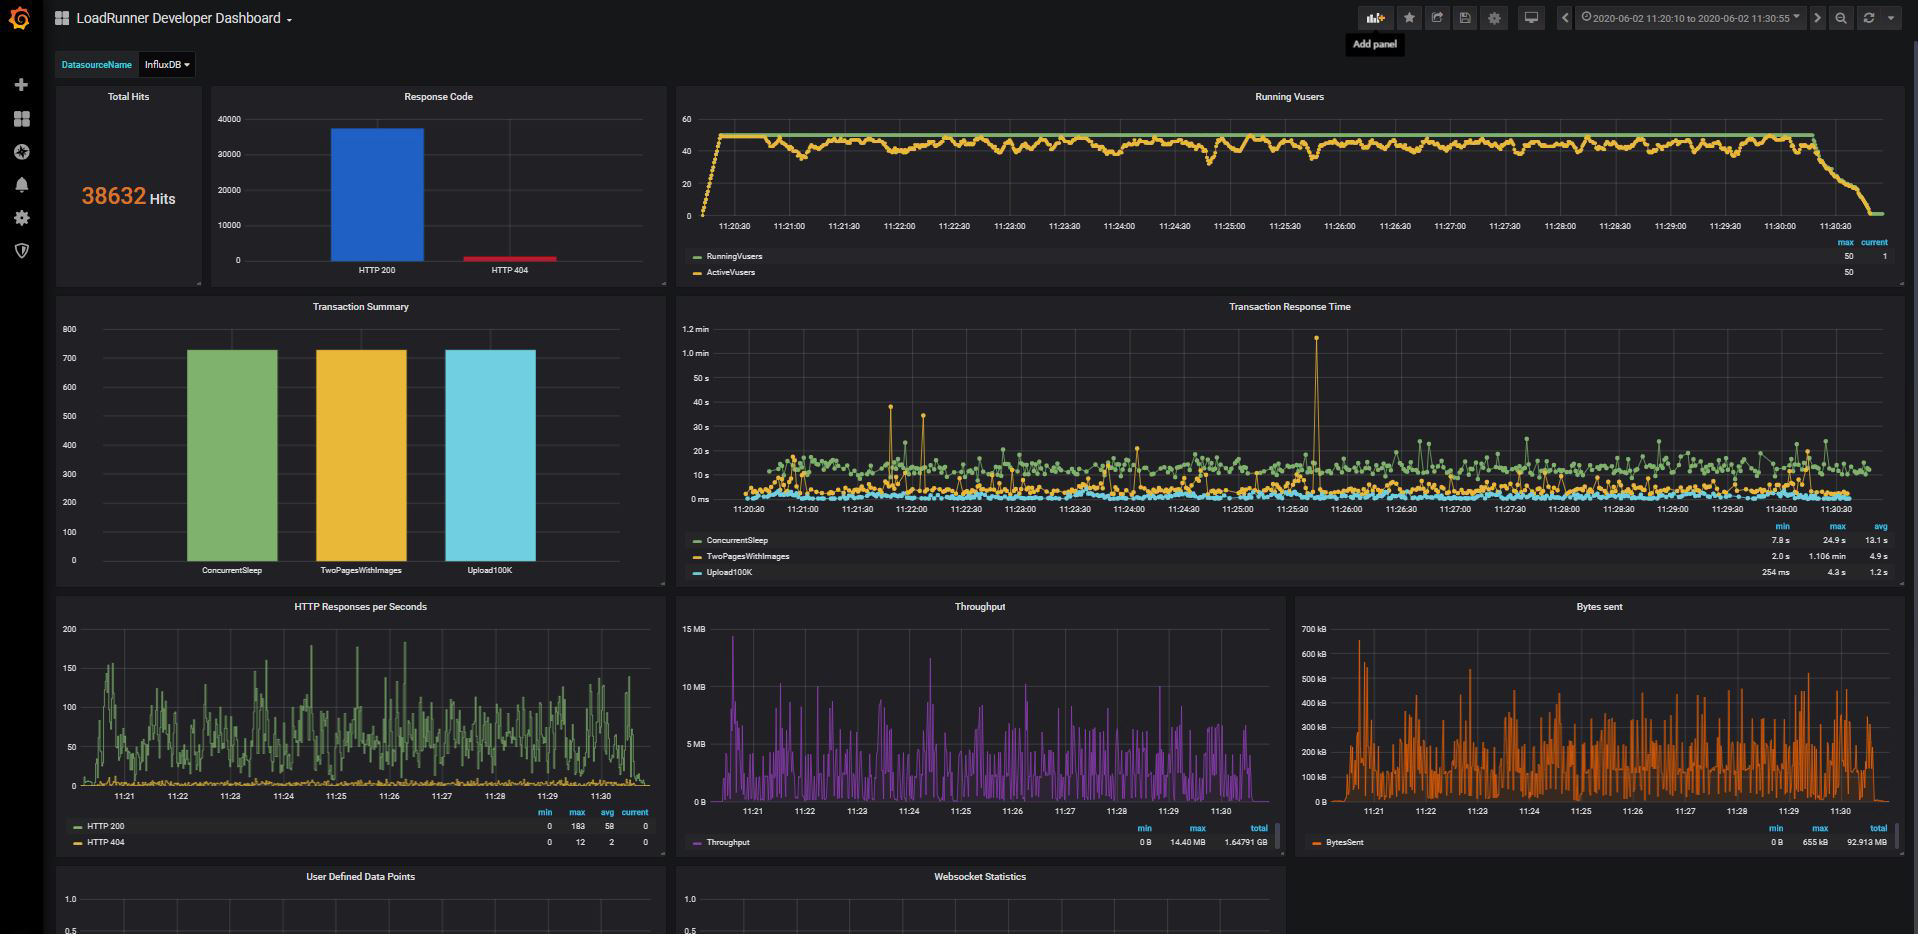
LoadRunner Developer provides a Grafana dashboard sample that demonstrates how DevWeb measurements, stored in InfluxDB, can be visualized in the Grafana tool. You can download the sample from the AppDelivery Marketplace.
For more details on using Grafana, see Using InfluxDB in Grafana.
For more information on importing a dashboard in Grafana, see Export and Import.
 See also: