This use-case scenario describes how to design a topology that graphically displays the logical components that make up your AUT and the relationships between the components.
-
John is a performance engineer working with Web Tours. He would like to design a performance test for the application.
As a first step, he would like to model the application in LoadRunner Enterprise so that he can keep track of the topology of his application under test. Using this model, he can benefit from the monitoring and online view features that the topology feature offers.
-
Create the topology and design the outline
-
From the LoadRunner Enterprise navigation toolbar, John selects Topologies to open the Topology module, and clicks the New Topology
 button to create a new topology. He calls the topology WebTours, and enters the details of the SiteScope server with which the application will interact for monitoring purposes.

-
John's Web Tours application comprises the following components: A web server, an application server, and a database server. The user accesses the application through a client workstation.
-
John connects the application server to the web server by clicking the application server (ensuring that it is not selected) and dragging the cursor over to the web server.
When John clicks OK, the Topology Designer window opens, displaying the Topology canvas which, at this stage, is empty.
In the Topology Designer window, from the palette on the left, John drags the nodes representing these components onto the Topology canvas, and changes their captions to names that are relevant to the components they represent.
John drags the following nodes:
Palette Category
Component
New Caption
Web Servers
Microsoft IIS
Web Server
Application
Microsoft ASP Server
Application Server
Database
Microsoft SQL Server
Database Server
Miscellaneous
Workstation
Client
Miscellaneous
User
User

Similarly, he connects the application server to the database server, the client workstation to the web server, and the user to the client.

-
-
The AUT hosts are the physical machines that host the relevant components of the application under test.
On the Topology Designer window, John clicks AUT Hosts. He then clicks Add New AUT Host
 , and enters the name and details of the machine that hosts the database server:
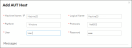
John then adds the AUT host that hosts both the application and web servers.
Tip: John can view the list of AUT hosts in the AUT Hosts tab by clicking AUT Hosts next to the Palette tab.
-
Define the component properties
For successful integration with SiteScope, John needs to ensure that the properties for each component are defined correctly.
John selects each component and, in the Properties pane in the top right corner of the Topology Designer window, he provides the relevant properties. The properties differ from one type of component to another.
Tip: A description for each property is displayed in the lower area of the Properties pane, and helps John to understand what information to provide for each property.
For example, for the database server, John selects machine33 from the AUT Host drop-down list, and accepts the default values for all of the other properties. Then he provides the relevant details for the application and web servers.

-
John selects the three servers and clicks Deploy Monitor Templates. LoadRunner Enterprise creates a monitor group in SiteScope for each of the selected components, and deploys the relevant system-defined monitor templates for each component. Because the AUT Host Templates property is enabled, the templates for the actual AUT host are deployed as well.
Tip: If John wants to view or modify these monitors, he can do so by clicking Configure Monitors on the toolbar, which opens SiteScope and displays the monitor trees that were created for each component.
-
John saves the topology and closes the Topology Designer window. He selects this topology when designing the performance test for the Web Tours application. When he runs the test, he can view the SiteScope monitor activity on the relevant components in the application in the Performance Test Run page.

 See also: