Monitors
This topic describes how to create and configure monitor profiles, which can be used by any performance test in your project, to monitor server resources during a performance test run.
In this topic:
- Monitors overview
- Monitor types
- Create a monitor profile
- Create a monitor over firewall agent
- Troubleshoot monitors
Monitors overview
You monitor performance test execution using the LoadRunner Enterprise online monitors.
To monitor server resources, you must configure the monitor settings for a performance test. You select the type of monitors to run, the servers whose resources you want to monitor, and add the measurements to monitor for each server. These monitor settings can then be saved as a monitor profile that can be used by any performance test in your project.
During performance test execution, the collected measurement data appears in the online graphs.

Monitor types
All of the monitors allow you to view a summary of the collected data at the conclusion of the performance test. Using LoadRunner Analysis, you can generate a graph for any of the monitors. For details, see the LoadRunner Professional Help Center.
The online monitors are divided into monitors enabled by default and monitors requiring configuration.
The following monitors are enabled by default, and automatically begin monitoring at the start of a performance test.
| Name | Description |
|---|---|
| Run-Time monitor | Display the number and status of Vusers participating in the scenario, as well as the number and types of errors that the Vusers generate. |
| Transaction monitor | Display the transaction rate and response times. |
| Web Resource | Provide information about the number of Web connections, throughput volume, HTTP responses, server retries, and downloaded pages at the web servers during performance test run. |
| Load Test System Resource monitor |
Provides basic Windows monitor data for all host machines involved in a performance test (except for Dockerized and Cloud load generators and OFW machines). This data (Host CPU, disk space, and memory) is available during a performance test run in the online graphs, or afterwards when collating and analyzing the results. Note: To monitor load generators using the default monitors, the user account on the load generator hosts must have the same credentials as the LoadRunner Enterprise account and have permissions to connect. We recommend adding a corresponding user to the load generator machines with the required permissions. You can disable the default monitors from the Test Options. For details, see Configure general test options. |
Monitors requiring configuration
The following monitors need to be configured as described in Create a monitor profile.
| Category | Description |
|---|---|
| AppDynamics Graphs |
Provide information on the availability and performance of software applications and the impact on user experience measured by AppDynamics. |
|
Application Deployment Solutions |
Measure statistics related to the Citrix MetaFrame XP server during a performance run. |
| CA APM Graphs |
Provide analytics from the CA APM (Application Performance Management) server about monitored Web applications. |
| Database Server Resource Graphs |
Measure database resource usage statistics for Oracle or SQL Servers during a performance test run. You use these monitors to isolate database server performance bottlenecks. |
| Dynatrace AppMon Graphs |
Provide information on the availability and performance of software applications and the impact on user experience measured by Dynatrace AppMon. |
| Dynatrace SaaS Graphs |
Provide the Controller access to data measured by Dynatrace SaaS, a cloud-based APM tool using theDynatrace SaaS monitor. |
| Network Graphs | Display information about the network delays on your system using the Network Delay Time monitor. |
| Network Virtualization Graphs |
Measure statistics related to network virtualization, such as Packet Loss and Latency.
|
| New Relic Graphs |
Provide information on the availability and performance of software applications and the impact on user experience measured by the New Relic Digital Intelligence Platform. |
| SiteScope Graphs |
Use the SiteScope monitor and its counters to measure resources. For information, see the documentation provided with SiteScope.
|
| System Resource Graphs |
Measure the Windows, UNIX, SiteScope, and SNMP system resource usage on a machine during a test run, and helps you determine why a bottleneck occurred on a particular machine. Note: The resource monitors are automatically enabled when you execute a test run. However, you must specify the machine you want to monitor and which resources to monitor for each machine. You can also add or remove machines and resources during the test run. |
| Web Application Server Graphs |
Measure Microsoft Active Server Pages servers during a test run and isolate application server performance bottlenecks. |
| Web Server Resource Graphs |
Provide you with information about the resource usage of the Microsoft IIS and Apache web servers during performance test execution. |
Create a monitor profile
This task describes how to create and configure a monitor profile.
-
-
Use a proxy server. If your monitor accesses a server outside of your internal network, you may need to set up a web proxy to collect data from it.
-
To do so, open the following files in a text editor
LoadRunner Enterprise server
- bin\MEApplication.exe.config
- PCWEB\Web.config
LoadRunner Enterprise host bin\wlrun.exe.config and add the following under the configuration > system.net section of the file:
<system.net>
<defaultProxy enabled="true">
<proxy proxyaddress="http://<PROXY_ADDRESS>:<PORT>" bypassonlocal="True" />
</defaultProxy>
</system.net> -
Restart IIS after adding the proxy in the PCWEB\Web.config file (type 'iisreset' in a command line).
-
- Configure the monitoring environment on the server machine. To use the Citrix, Network Delay Time, Oracle, or UNIX monitor, you must first install or configure monitoring components on the server machine. For details, see the specific monitoring sections.
-
-
Select a resources folder
Select a resources folder for the monitor profile, or create a new folder. To create a new folder:
-
From the LoadRunner Enterprise navigation toolbar, click
 and select Monitors (under Assets).
 -
Click
 New Folder to create a new folder for your monitor resources.
-
-
-
Click
 New Monitor Profile.
 -
Enter a name and optional description for the monitor profile and click OK.
-
Click
 Add Monitor.
 -
Select the monitor type that you want to add.
-
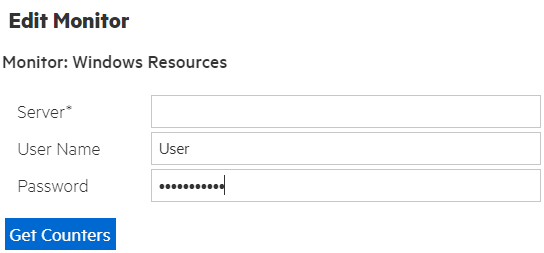
Enter the required information and select the counters that you want to monitor. The fields in the dialog box vary according to the monitor type selected (see the help topic for the specific monitor for details).
-
-
View or edit monitor details
After creating a monitor profile, the monitor details (name, the server whose resources are being monitored, and the counters being monitored), are displayed in the Monitor Profiles grid.
Click
 Edit Monitor to add and manage a monitor type for the selected monitor profile.
The Related Tests pane displays details about tests to which the monitor has been assigned. Click the ID link to display a related test in the Performance Test Designer.
-
Associate monitors and monitor over firewall agents with your test
-
From the LoadRunner Enterprise navigation toolbar, click
and select Test Management (under Testing). -
Select a performance test in the test management tree and click Edit Test.
-
In the Performance Test Designer window, click the Assets tab and select Monitors.
-
Click
 Assign Monitors. Select the monitors or monitor folder to assign to your test, and click Select. The selected monitors are added to the Monitors grid for the test.
 You can remove monitors from a test at any time by selecting the monitors you want to remove, and clicking
 Remove.
To view details of a monitor profile, click the Name link.
-
Create a monitor over firewall agent
You must define monitor over firewall agents in the system before you can select them to monitor a test.
-
Select a resources folder
Select a resources folder for the monitor over firewall agent, or create a new folder. To create a new folder:
-
From the LoadRunner Enterprise navigation toolbar, click
and select Monitors (under Assets). -
Click
New Folder to create a new folder for your monitor resources.
-
-
Create a new monitor over firewall agent
-
Select a folder for storing the monitor over firewall agent, and click
 New Monitor Over Firewall.
 -
In the Create Monitor Over Firewall dialog box, enter a name, the machine key for the monitor over firewall agent, and select the MI Listener with which the monitor is to connect.
-
Click OK.
-
-
Associate the monitor over firewall agent with your test
-
From the LoadRunner Enterprise navigation toolbar, click
and select Test Management (under Testing). Select a performance test in the test management tree and click Edit Test. -
In the Performance Test Designer window, click the Assets tab and select Monitors.
-
Click
Assign Monitors. Select the monitor over firewall to assign to your test, and click Select. The selected monitor over firewall is added to the Monitors grid for the test.
-
Troubleshoot monitors
This section provides information on troubleshooting monitors.
Problem Description
You are unable to create a specific monitor.
Troubleshooting
-
Make sure that the user trying to access the machine to monitor exists on this machine and has proper privileges. Usually IUSR_METRO is the user attempting to monitor.
For example, if you add the Windows Resources monitor, the user IUSR_METRO must exist on the machine to be monitored and must have proper access rights.
-
Some monitors require certain clients to reside on the Utility Server and the Controller.
For Oracle, the Oracle Client must be installed.
-
Make sure the agent required for a particular monitor is running on the machine that you want to monitor.
-
Some monitors require access to a particular URL, from both the LoadRunner Enterprise utility server and the Controller, for monitoring purposes.
For Apache, this URL is:
http://<server>:<port>/server-status:auto
Monitor fails to retrieve measurements
Problem Description
This problem can occur with Windows Resource, Microsoft IIS, Microsoft SQL, or Microsoft ASP monitors when:
-
Configuring a monitor (when you click Get counters), or
-
During a test run (for example, if you have created a monitor profile and then change the LoadRunner Enterprise system user and run the test). An error is displayed in the Errors window and no data is displayed in the monitor's online graphs.
Cause:
The LoadRunner Enterprise Server sends messages to the monitored server using the SMB2 protocol. This protocol uses the supplied user credentials for the session initialization, but the monitored machine sends another authentication request to the client, and the client sends the credentials of the user who runs the process that initiated the connection—the LoadRunner Enterprise system user account (IUSR_METRO by default).
If that user account does not exist on the remote server, authentication fails and the user that is being used for authentication and metrics retrieval is the one whose user name and password are provided in the LoadRunner Enterprise user interface when creating the monitor (when entering the server name and credentials in the Monitor Profile configuration).
If the LoadRunner Enterprise system user account exists on the monitored server, but is not a local admin on the remote server (or does not have the required permissions), the initial authentication succeeds, but retrieving the metrics from the remote server fails because the credentials provided in LoadRunner Enterprise when creating the monitor are not being used.
Solution:
-
Remove the LoadRunner Enterprise system user from the monitored machine, or
-
Deny access of the LoadRunner Enterprise system user to the monitored machine from Local security policy > User rights assignment > Deny access to this computer from the network.
Some monitors do not display data
Problem Description
This problem can occur with PDH monitors, which include Windows Resources, MS IIS, SQL Server, Citrix Server, and Microsoft ASP.
These monitor require a NET USE connection to retrieve measurement data. When you select measurements or counters to monitor, the MonitorClient.exe process on the LoadRunner Enterprise agent machine uses the logged in user’s NET USE to connect to the application under test (AUT).
However, during the performance test run, the LoadRunner Enterprise agent invokes the MonitorServer.exe process to retrieve data from the AUT using the local user, IUSR_METRO. This means there is no NET USE connection between the Monitor Over Firewall machine and the AUT during the test run, resulting in no measurement data being received on the PDH monitors.
Troubleshooting
Ensure that the magentservice.exe on the Monitor Over Firewall machine is installed with the same user that you used to log on when you selected measurements or counters to monitor.
Perform the following steps on the Monitor Over Firewall Machine:
-
Stop the LoadRunner Agent Service.
-
Select Start > Run and type
services.msc. -
In the services list, right-click LoadRunner Agent Service and select Stop.
-
-
Select Start > Run and type
cmd. The Command window opens. -
Type the following and press Enter:
cd <LoadRunner Enterprise Monitor over Firewall installation>\launch_service\bin
-
Type the following and press Enter:
magentservice –remove
-
Type the following and press Enter:
magentservice –install <Logged on user name> <Password>
-
Restart the LoadRunner Agent Service using the same procedure described in step 1.
Disabling automatic host monitors
Problem Description
The host monitors feature automatically configures basic windows monitor data for all host machines involved in a performance test (except for Dockerized and Cloud load generators and OFW machines). This data (CPU, disk space, and memory) is available during a performance test run in the online graphs, or afterwards when collating and analyzing the results. This feature is convenient as it works with auto-matched load generators. However, in environments where the network ports are closed, this feature may cause a significant slowdown when starting a performance test run.
Troubleshooting
Disable the host monitors. In the Groups and Workload tab, select More >  Test Options > Disable Default Monitors.
 See also: