TruClient Native Mobile monitor graphs
This section describes the TruClient Native Mobile monitor graphs that are available during a test run.
In this topic:
- Total CPU Utilization Percentage graph
- Total Free Memory in Devices graph
- Total Memory Consumed by Application graph
Total CPU Utilization Percentage graph
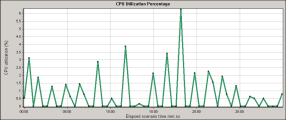
This graph displays the percentage of the CPU utilized during the test run for TruClient Native Mobile Vuser scripts.
| Purpose | Helps you evaluate the amount of CPU utilized by an application. |
| X-axis | Elapsed time since the start of the test run. |
| Y-axis | The percentage of the CPU utilized during the test run. |
In the following example, the CPU utilization peaked to approximately 6% at 18 minutes into the test run.
Total Free Memory in Devices graph
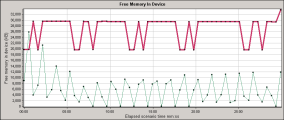
This graph displays the free memory on a mobile device as a function of time, for TruClient Native Mobile scripts.
| Purpose | Helps you evaluate the amount of memory available on the device during the test run. |
| X-axis | Elapsed time since the start of the test run. |
| TEST | The amount of free memory in KBs. |
In the following example, the graph shows a free memory of over 33 MBs, at 30 minutes into the test run for one of the transactions.
Total Memory Consumed by Application graph
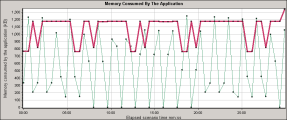
This graph displays the memory consumed by the application, as a function of time.
| Purpose | Helps you evaluate the amount of memory used by the application. |
| X-axis | Elapsed time since the start of the test run. |
| TEST | The memory consumed by the application in KBs. |
In the following example, the memory consumption peaked to 1337 KBs at 30 minutes into the test, for one of the transactions.
 See also:


