Network Delay Time monitor
This section explains how to define the Network Delay Time server whose resources you want to monitor, and to select the counters to monitor.
Network monitoring overview
Network configuration is a primary factor in the performance of applications. A poorly designed network can slow client activity to unacceptable levels.
You use Network monitoring to determine whether your network is causing a delay in the performance test. You can also determine the problematic network segment.
In a true Web or client/server system, there are many network segments. A single network segment with poor performance can affect the entire system.
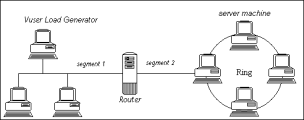
The following diagram shows a typical network. To go from the server machine to the Vuser machine, data must travel over several segments.
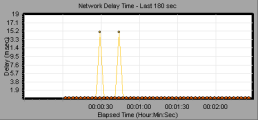
The Network Delay Time monitor shows the delays for the complete path between the source and destination machines (for example the database server and Vuser host). The graph maps the delay as a function of the elapsed performance test time. Each defined path is represented by a separate line with a different color in the graph.
To measure network performance, the Network monitor sends packets of data across the network. When a packet returns, the monitor calculates the time it takes for the packet to go to the requested node and return. This time is the delay which appears in the Network Delay Time graph.
Note: The delays from the source machine to each of the nodes are measured concurrently, yet independently. It is therefore possible that the delay from the source machine to one of the nodes could be greater than the delay for the complete path between the source and destination machines.
Configure the network monitoring environment
This task describes how to configure the monitoring environment for the Network Delay Time monitor.
-
Prerequisites
-
To enable network monitoring, you must install the LoadRunner Enterprise agent on the source machine. You do not have to install the LoadRunner Enterprise agent on the destination machine.
-
To run the Network monitor, you must have administrator permissions on the Windows source machine (unless you are using the ICMP protocol).
-
-
Configure the Linux source machine - optional
You can run the Network monitor on Linux source machines, using UDP or ICMP. Before running the Network monitor from a Linux source machine, configure the source machine. For task details, see Configure the Linux source machine for network monitoring.
-
Configure the firewall between the source and destination machines - optional
If you are monitoring a network in which there are firewalls between the source and the destination machines, you must configure the firewalls to allow the network data packets to reach their destinations.
-
If you are using the TCP protocol, the firewall that protects the destination machine must not block outgoing ICMP_TIMEEXCEEDED packets (packets that are sent outside the firewall from the machine). In addition, the firewall protecting the source machine must allow ICMP_TIMEEXCEEDED packets to enter, as well as TCP packets to exit.
-
If you are using the ICMP protocol, the destination machine's firewall must not block incoming ICMP_ECHO_REQUEST packets, or outgoing ICMP_ECHO_REPLY and ICMP_ECHO_TIMEEXCEEDED packets. In addition, the firewall protecting the source machine must allow ICMP_ECHO_REPLY and ICMP_ECHO_TIMEEXCEEDED packets to enter, and ICMP_ECHO_REQUEST packets to exit.
-
If you are using the UDP protocol, ensure that the UDP protocol can access the destination machine from the source machine. The destination machine's firewall must not block outgoing ICMP_DEST_UNREACHABLE and ICMP_ECHO_TIMEEXCEEDED packets. In addition, the firewall protecting the source machine must allow ICMP_DEST_UNREACHABLE and ICMP_ECHO_TIMEEXCEEDED packets to enter.
Note: To run the Network Delay monitor when there are firewalls between the Controller and the source machine, you must configure the LoadRunner Enterprise agent, MI Listener, and Network Delay monitor for monitoring over a firewall.
-
-
Configure the monitor as described in Set up the Network Delay Time monitor.
Set up the Network Delay Time monitor
This task describes how to set up the Network Delay Time monitor.
-
Select a resources folder.
Select a resources folder for the monitor profile in the resources tree, or create a new folder as follows:
-
In the top banner, click the module name or the dropdown arrow and select Assets > Monitors.
-
Click the New Folder button
 and enter a name for the monitor resources folder.
-
-
Create a monitor profile.
-
Click the New Monitor Profile button
 , and make sure Monitor Profile is selected.
 -
Enter a name and optional description for the monitor profile, and click Save. An empty monitor profile is added to the selected resources folder.
-
Select the monitor profile you just added and click the Add Monitor button
 .
.
-
In the Monitor Type Selection tab, select the Network Delay Time monitor type and click Next.
-
In the Monitor Definition tab, enter the server details:
UI Elements
Description
Source Machine Select the source machine from which you want the network path monitoring to begin.
To run the Network Delay Monitor when there are firewalls between the LoadRunner Enterprise Host machine and the source machine, type the server name or IP address of the source machine according to the format:
<MI Listener machine>:<source machine local key>where
source machine local keyis the unique key that you chose when configuring the LoadRunner Enterprise agent on the source machine, for example 12.12.12.3:vdsNote: The IPv6 format is not supported.
When working with Over Firewall (OFW) load generators or monitors, the
<source machine local key>_<location>is mandatory. The OFW machine must also be added as a host in LoadRunner Enterprise Administration. For details, see Specify MI Listeners.For details about working with firewalls in LoadRunner Enterprise, see the firewall section in the LoadRunner Enterprise Installation Guide (available from Installation).
Platform Select the platform on which the machine runs.
Destination Machine Enter the name or IP of the machine at the final destination of the path you want to monitor. For a list of the supported formats, see the Support Matrix.
If the destination machine is localhost, enter the local machine's name and not localhost.
Send Next Packet Enter the number of milliseconds for the monitor to wait between receiving a packet and sending out the next packet. If you have a long, steady performance test, increase the interval by several seconds.
Default: 3000 milliseconds
Wait Enter the maximum number of seconds for the monitor to wait for a packet to return before it retries to send the packet.
Default: 3 seconds. If your network is large and loaded (an internet connection with a low capacity), increase the value by several seconds. If you have a small network (such as a LAN), decrease the value.
Number of Retries Enter the number of attempts for the Network monitor to try to resend a packet to a node if the packet is not initially returned.
Default: 0
Send Request Using Select the relevant protocol. It is recommended that you keep the default protocol. In Windows, the default is TCP, and in UNIX, the default is UDP.
Send Request to Port Enter the port number being used by the network path.
Enable display of network nodes by DNS names Select to view the DNS name of each node along the network path, in addition to its IP address. Note that selecting this option decreases the speed of the Network monitor.
-
Click Save. The monitor details are displayed in the Monitors tab for the selected monitor profile.
-
-
Associate the monitor with your test.
For details, see Step 3: Associate monitors with your test.
Notes and limitations
This section describes troubleshooting for the Network Delay Time monitor.
If monitoring is unsuccessful and LoadRunner Enterprise cannot locate the source or destination machines, make sure that the specified machines are available to your machine. Perform a "ping" operation. At the command line prompt, type Ping server_name.
To check the entire network path, use the trace route utility to verify that the path is valid.
-
For Windows, type
tracert <server_name> - For UNIX, type
traceroute <server_name>
If the monitoring problem persists once you verify that the machines are accessible and that the network path is valid, perform the following procedures:
-
If you are using the TCP protocol, run <LRE_installdir>\bin\webtrace.exe from the source machine to determine whether the problem is related to the Controller, or the WebTrace technology on which the Network Delay monitor is based. If you are using the UDP or ICMP protocols, the problem must be related to the Controller and not WebTrace, because these protocols are not WebTrace technology-based.
-
If you receive results by running webtrace.exe, the problem is related to the Controller. Verify that the source machine is not a UNIX machine, and contact the Customer Support Web site with the following information:
-
The Controller log file, drv_log.txt, located in the temp directory of the Controller machine.
-
The traceroute_server log file, located on the source machine.
-
the debug information located in the TRS_debug.txt and WT_debug.txt files in the path directory. These files are generated by adding the following line to the [monitors_server] section of the <LRE_installdir>\dat\mdrv.dat file, and rerunning the Network monitor:
ExtCmdLine=-traceroute_debug path -
If you do not receive results by running webtrace.exe, the problem is related to the WebTrace technology, on which the Network Delay monitor is based. Perform the following procedures on the source machine:
-
Verify that the packet.sys file (the Webtrace driver) exists in the WINNT\system32\drivers directory.
-
Check whether a driver (such as "Cloud" or "Sniffer") is installed on top of the network card driver. If it is, remove it and run WebTrace again.
-
Verify that there are administrator permissions on the machine.
-
Using
ipconfig /all, check that only one IP address is assigned to the network card. WebTrace does not know how to handle multiple IP addresses assigned to the same card (IP spoofing). -
Check the number of network cards installed. Run
webtrace –devlistto receive a list of the available network cards. -
If there is more than one card on the list, run
webtrace -dev <dev_name> <destination>, where<dev_name>is one of the network card names shown in the list. If you discover that WebTrace is binding to the wrong card, you can usewebtrace set_device <dev_name>to set a registry key that instructs WebTrace to use a specified card instead of the default one. -
Verify that the network card is of the Ethernet type.
-
Contact the Customer Support Web site with the output of
webtrace.exe –debug(for example,webtrace.exe –debug www.merc-int.com) andipconfig /allon the machine.
 See also:


