
Share this page


Manage test runs and results
This section describes how to view and manage test results and related actions for test runs.
In this topic:
- Collate run data
- View test run details
- Manage test results
- View results in the dashboard
- Download and upload result files
- View test run event logs
- View changes made to a test run
- Perform quick trending analysis
Collate run data
When you run a test, by default all the run data is stored locally on each load generator. After the performance test runs, to generate analysis data, the results must be gathered into one location so that they can be processed for analysis. This process is known as data collation.
You can set whether run data is automatically collated during runtime, or as soon as the run is complete (see Configure collate options). Alternatively, you can manually collate the run data after the run (see Post Run Action). This way, you can save and close a test, and collate the data at a later stage.
In addition to collating the results data, you can collate data from OpenText Network Virtualization and from the log files. After successfully collating the data, these files are deleted from the load generators from which they were gathered.
After results are collated, you can analyze them using different tools. For details, see View and analyze test results.

View test run details
You can view details of a performance test run in the Runs grid.
To view runs for a performance test:
-
In the banner, click the module name or the arrow and select Test Management > Tests & Scripts / Runs.
-
Select a performance test in the test management tree, and open the Runs tab.
If the test is running, click the ID link to display the test in the Run dashboard. If the test run has finished, click the ID link to open the test in the offline view.
To filter, sort, or group runs displayed in the runs grid, see Personalize your display.
The Runs grid displays the following information.
UI Elements Description ID The result file ID. If the test has finished, click the ID link to display the results in the Results page. For details, see View test run results offline.
Name The name of the test run. If the test is running, click the name link to display the test in the Run dashboard.
State Displays the current state of the selected test runs. If the test is running, click the state link to display the test in the Run dashboard.
SLA Status  Passed. Indicates a passed SLA status.
 Failed. Indicates a failed SLA status.
 N/A. Indicates that there is no data about the SLA status.
 Not Completed. Indicates the collating results process is not finished.
Test Name The name of the test. Click the Test Name link to display the test in the Performance Test Designer. For details, see Performance Test Designer.
Start/End Date The start and end date and time of the test run. Last Modified Enables you to filter the information being displayed in the Test Runs grid by the last modified date. Click the drop-down arrow to apply a filter. Test ID The test run ID.
Test Instance ID The ID of the test instance linked to the timeslot.
Tester The name of the user running the test.
Duration The time, in minutes, that the test took to run.
Test Set Name The name of the test set. Test Set ID The test set ID. Timeslot The ID of the test run timeslot. Click the Timeslot link to open the test in the Timeslots page. For details, see View or edit a reserved timeslot.
Controller The name of the Controller machine used in the test run.
Load Generators The names of the load generator machines used in the test run. Vusers Involved The number of Vusers that were initialized at least once during the run. Vusers Max The maximum number of concurrently running Vusers during the run. Vusers Avg The average number of concurrently running Vusers during the run. Errors The total number of errors during the test run. TX Passed The total number of passed transactions during the test run. TX Failed The total number of failed transactions during the test run. Hits/Seconds The total number of hits per second during the test run. VUFDs Amount The amount of VUFDs involved in the action. Analysis Template Indicates whether Analysis Templates were used in the test run. Using VUFDs Indicates whether VUFDs were used in the test run. Comments Comments added to the test run. Jenkins Job Name Name of the Jenkins job if you are running tests as part of your Jenkins continuous integration process. Operating System Operating system of the machine that runs the job. Test Description A description of the test. -
To display the above details about a run, select a row in the runs grid, and click the Details tab.
To add comments to a test run, click the Comments button
 , and enter text as required.
 Note: Comments cannot contain any of the following characters: | = !
-
To display event logs for a selected test run, select a row in the runs grid, and click the Event Log tab. For details, see View test run event logs.
-
To download (or upload) result files for a selected test run, select a row in the runs grid, and click the Results tab. For details, see Download and upload result files.
Manage test results
You can manage results and related actions for test runs.
To access:
-
In the banner, click the module name or the arrow and select Test Management > Runs. In the test management tree, select a performance test and click the Runs tab.
-
Select Test Management > Tests & Scripts. In the test management tree, select a performance test and click the Runs tab.
You can perform the following actions from the Runs toolbar or context menu.
| Action | How to |
|---|---|
| View results |
For a test run in the Finished state, click the View Results button |
| View HTML summary report |
You can view an HTML version of the Analysis Summary report opens, which analyzes the data collected during the performance test run (available for test runs in Finished state only). For a test run in the Finished state, click the HTML Report button |
|
Analyze results |
For a test run in the Before Creating Analysis Data state, right-click the run, and select Analyze. Results are analyzed for the selected test run, and the temporary results are deleted from the load generators and the Controller. |
| Collate results |
For a test run in the Before Collating Results state, right-click the run, and select Collate. Results are collated for the test run. Note:
|
| Recover results |
For a test in the Run Failure or Failed Collating Results state, right-click the run, and select Recover results to recover and collate the results of a failed test run. Note: Enables you to collate results only up to the point where the test failed. |
| Select runs from a specific test set |
To display run results for a test set, click the Test Sets drop-down arrow, and select a test set. Note: The test set menu is only available when you select the root folder ('Subject') in the Test Management tree. |
| Rename a run |
To rename a run, right-click a run, select Rename, and enter a new name for the run. Note: Not available when the test is in an active state (Initializing, Running, or Stopping). |
| Go to timeslot |
To view timeslot details for the test run, right-click a run, and select Go to Timeslot. |
| Recalculate SLA |
Right-click a run, and click the Recalculate SLA button
Note: This feature is available only if SLAs were defined during the performance test design phase, and to run instance with Finished state. For details about SLAs, see Define service level agreements (SLAs). |
| Add run to trend report |
Adds the selected test run to a trend report.
Note: Available only for run instances with Finished state. For details, see Trend reports. |
| Export run data to Excel |
Click the Export to Excel button |
| Delete runs |
Select the test runs you want to delete, and click the Delete button Note:
|
| Display latest run data |
Click the Refresh button |
| Filter, sort, or group the run data |
For details, see Personalize your display. |
 .
.  . The selected test runs together with their results are deleted from the project, the Admin Runs list, and all trend reports in which they appear.
 to display the most up-to-date information in the runs grid.
View results in the dashboard
You can view run results in the dashboard.
To view run results:
-
In the banner, click the module name or the arrow and select Test Management > Tests & Scripts.
-
Select a performance test in the test management tree, and open the Runs tab.
-
Select a test run, and click the View Results button
 .
. -
Click the Dashboard tab. The test runs dashboard opens, and displays performance measurements and results for resources that were monitored in the test run in the offline results page. For user interface details, see View results offline.
Download and upload result files
You can download or upload result files for a selected test run.
To download or upload result files:
-
In the banner, click the module name or the arrow and select Test Management > Tests & Scripts.
-
Select a performance test in the test management tree, and open the Runs tab.
-
Select a test run, and click the View Results button
. -
In the Results tab, choose the type of result data you want to view.
Data Type Description Output Log Select the SqliteDb.db.zip file (previously output.mdb.zip). The database created by OpenText Enterprise Performance Engineering stores all the output messages reported during the performance test run. This is useful for troubleshooting errors.
Output Log (Vuser Execution) Select the VuserLog.zip file. Contains the Vuser run log. You can change the log settings in the Runtime Settings dialogue box in the Performance Test Designer. For details, see Configure runtime settings.
Raw Results Select the RawResults_<#>.zip file. Contains result information in its raw format. Can be used to generate the full results using the Analysis tool. For details, see Analysis.
Rich Report Select the HighLevelReport_<#>.xls file. Contains a high-level report of the run results in an Excel file.
HTML Report Select the Reports.zip file. Contains an HTML version of the Analysis Summary report.
Note: If you delete the Reports.zip file, the HTML Report link is not available in the results page. For details, see View results offline.
Analyzed Results Select the Results_<#>.zip file. Contains the Analysis Summary report, which analyzes the data collected during the performance test run.
User files Select the Userfile.<file type> file. Files attached by users to provide additional information about the test run.
-
Select the results file you want to download, and click the Download button
 to download the file.
 -
To upload attachments that provide additional information about the currently selected results file, select the results file you want to upload, and click the Upload
 . All uploaded files are displayed as a USER FILE type.
View test run event logs
You can display event logs for a selected test run.
To display event logs for a test run:
-
In the banner, click the module name or the arrow and select Test Management > Tests & Scripts.
-
Select a performance test in the test management tree, and open the Runs tab.
-
Select a test run, and click the View Results button
. -
Click the Event Log tab. The Event Log grid displays the following information.
UI Element Description ID The event ID.
Event Type An indication of the event's severity. From most to least severe: error, warning, or info.
Create date The date and time the event was logged.
Event The name of the event.
Description A description of the event.
Responsible The user, or automated system process responsible for the event.
- To export the event log data to Excel, click the Export to XLS button
 .
.
View changes made to a test run
You can display a list of changes made to the currently selected test run.
To view changes made to a test run:
-
In the banner, click the module name or the arrow and select Test Management > Runs. The Runs grid opens.
Note: You can also see the Audit tab from Test Management, by choosing a test in the test management tree, and clicking the Runs tab. For details, see View or edit tests and test runs.
-
Click the ID link for the test run that you want to view.
-
Select the Audit tab. The Audit log opens, displaying the list of operations performed on the test run.
UI Element Description Field Name The field modified during the change. Action Type Specifies the type of changes made to the field (for example Update, Insert). Old Value The value before the New Value (two before the current value). New Value
The previous field value (one before the current value). User Name Displays the login name of the user that made the change to the entity. Modified Date Displays the date and time of the operation in chronological order (or reversed chronological order). -
To filter the information being displayed in the grid, click the Filter button
 and select a filter. For more details, see Personalize your display.
 -
To export the Audit log data to Excel, click the Export to XLS button
.
Note: Administrators can display a list of changes made to other entity types, such as projects, users, hosts, and roles from Administration. For details, see Audit entities and user connections.
Perform quick trending analysis
You can perform quick trending analysis on test runs from the Test Runs and Test Management page. You can view a summary of failed transactions, and then drill down and compare against previous runs to help identify trends and resolve issues.
To perform quick trending analysis:
-
Prerequisites
To view trend preview data for a test run, you must configure an external analysis server (InfluxDB) and assign the project to the server. For details, see Configure external InfluxDB analysis servers.
-
Run a test.
For details, see Create and manage tests.
-
Open Quick Trending.
Note: The Quick Trending tab is only available if an external analysis database server has been defined for the project. For details, see Manage analysis servers.
From the Description Test Runs page
-
In the banner, click the module name or the arrow and select Test Management > Runs. The Runs grid opens.
-
Click the ID link for the test run that you want to view. The test runs dashboard opens.
-
Click the Quick Trending tab.
Test Management page -
In the banner, click the module name or the arrow and select Test Management > Tests & Scripts.
-
Select a test in the test management tree, and click the Test Details tab. You can see a summary of failed transactions in the Failed Transactions pane.
Note: The pane shows "No data to display" if an external analysis database server has not been defined for the project.
-
Click the Run Details link, and then click the Quick Trending tab.
-
-
The Quick Trending page opens, displaying the trending transactions grid and a graphical representation of the top trending transactions that failed.
-
Total TRs represents the total number of transactions in the run.
-
Failed represents the total number of failed transactions (a transaction can fail multiple times).
-
-
Select the filters to sort the information being displayed in the grid.
Filter Description Transactions Click the Transactions dropdown, and select the number of failed transactions you want to display (Top 5, Top 10, or Top 15).
By Attribute Click the By Attribute dropdown, and select the attribute by which to sort transactions in the grid (in descending order):
-
Failed. Sorts transactions by the number of times the transaction failed.
-
Success Rate. Sorts transactions by their success rate (percentage).
-
Failed Rate. Sorts transactions by their failure rate (percentage).
-
TR Total Duration. Sorts transactions by their total duration time, in seconds.
In addition to the information above, the grid also displays the following information.
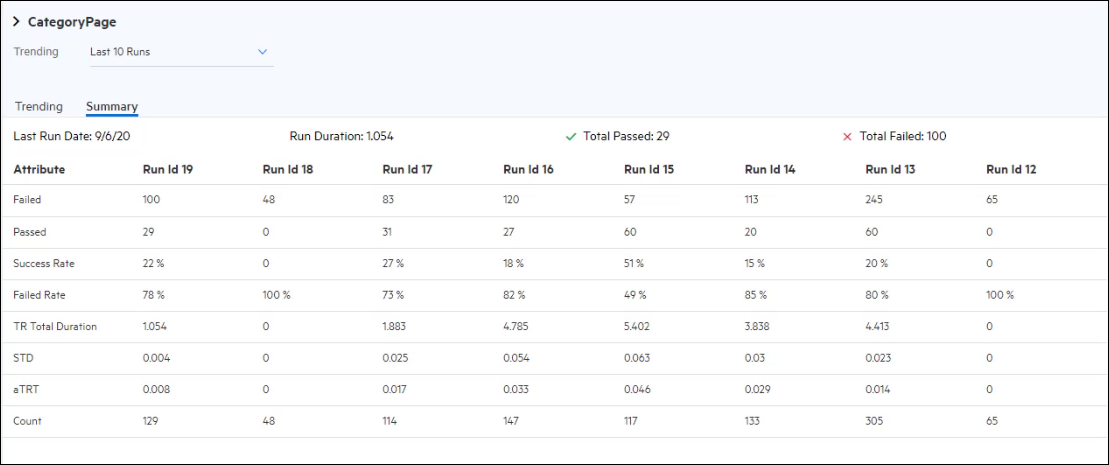
Measurement Description aTRT The average transaction response time of each transaction, in seconds, during the test run. STD
The standard deviation of each transaction during the test run. Count The number of times the transaction participates in the test run. -
-
Analyze failed transactions.
Click a transaction in the Trending Transactions grid to drill down on that transaction. Details of the failed transaction are displayed. Use this pane to help identify and analyze trends related to the run.
-
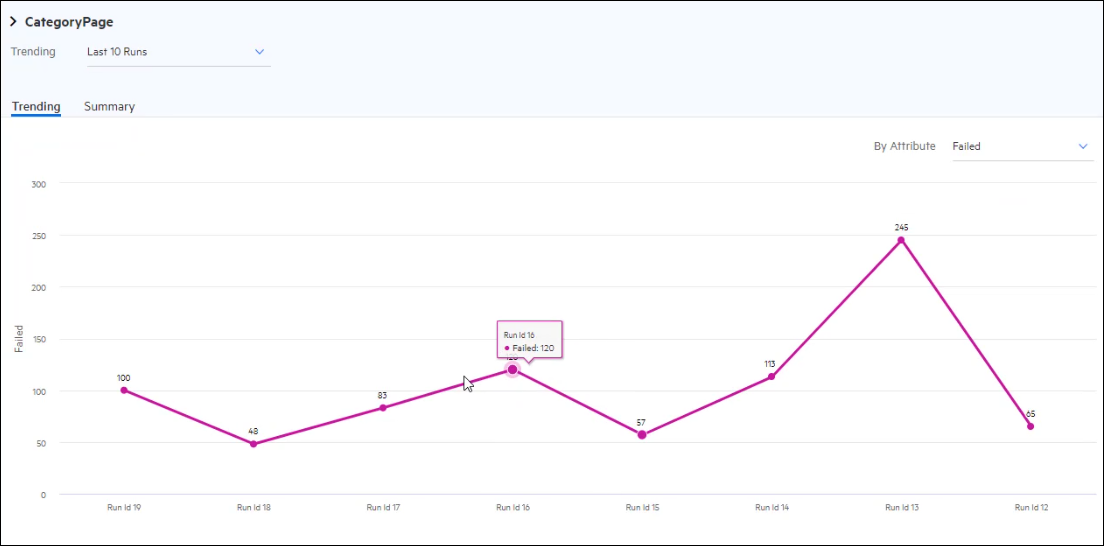
Click the Trending dropdown, and select the number of runs that immediately preceded this run to use as a comparison (Last 3, 5, or 10 runs).
-
The Trending tab displays a graphical representation of the failed transaction runs. Click the By Attribute drop down, and select the attribute by which to filter the transaction against preceding runs.
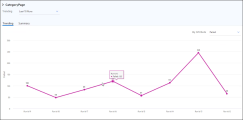
-
Use the Summary tab to compare data patterns and establish trends for the selected transaction runs.
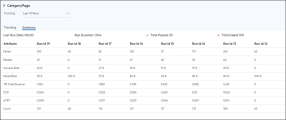
-
 See also:

