Share this page


Understand the Administration user interface
This section describes the buttons and modules in the Administration window.
Banner
The banner in Administration contains the following.
|
UI Element |
Description |
|
|---|---|---|

|
Settings. Opens the Settings dialog box, enabling you to configure the display format used in Administration. Select the date and time field format to use. Note: The changes only affect the administration site. |
|

|
Enables you to select the following options:
|
|
 <user name> <user name>
|
User options. Displays the current administrator user name. Select one of the following:
|
|

Modules
This section describes the modules in Administration.
Dashboard
The Dashboard area  provides a top level summary view of resources, including projects, runs, Vusers, load generators used, and license usage.
Maintenance
This table describes the Maintenance area .
| UI Element | Description |
|---|---|
|
Enables you to define, manage, and maintain the testing resources used for server-side testing.
|
|
| Enables you to view and manage test runs across all projects. For details, see Manage test runs. | |
| Enables you to reserve hosts for performing maintenance tasks. For interface details, see Manage timeslots. | |
|
Enables you to check the health of each component in your system. For details, see Maintain system health. |
Configuration
This table describes the Configuration area  .
.
| UI Element | Description |
|---|---|
|
Enables you to add and manage the following integrations:
|
|
| Enables you to manage the orchestrators and host images which are used for dynamic provisioning of Dockerized hosts. For details, see Provision Docker hosts automatically. | |
|
Enables you to add external cloud accounts and create and modify the templates used to provision dynamic cloud hosts. For details, see Manage elastic cloud hosts. |
|
| Enables you to manage licenses, VUFDs, and hosts. For details, see Manage licenses. | |
|
Enables you to manage the servers in your performance testing environment. For details, see Configure servers. |
|
|
Enables you to manage automatic notification alerts to keep track of test start and end times, test failures, and idle timeslots. For details, see Activate alerts. |
|
| Enables you to configure the authentication method for users and define the project file repository. For details, see Site configuration. |
Management
This table describes the Management area .
| UI Element | Description |
|---|---|
| Enables you to control access to projects by defining the user roles, and by determining the types of tasks each role performs according to permission levels. For details, see Assign project roles and permissions to users. | |
| Enables you to add and customize users, and assign them to roles and projects. For details, see Manage users in a project. | |
|
Enables you to create projects, and define the limits and other settings for the project. For details, see Create domains and projects and Manage projects. |
|
|
Enables you to view a list of changes made to entities (Projects, Pools, Users, Tests, and Runs) and track user login and logout times on the site. For details, see Audit entities and user connections. |
Report
This table describes the Reports area ![]() .
.
| Sub node | Description |
|---|---|
| Reporting Summary | Enables you to generate reports. For details, see Reports. |
|
Project Limit vs. Actual Use Report |
Displays concurrent resource usage per project and whether resources are used within the licensing limits. For details, see Project Limit vs. Actual Use report. |
| VUFDs Overall Usage report |
Displays VUFDs license usage for all projects over time and information about VUFD usage per day for each project. For details, see VUFDs Overall Usage report. |
| Protocol Granularity Report |
Displays the Vuser script's protocol usage. For details, see Protocol Granularity report. |
| Resource Summary Report |
Displays aggregated data showing how projects used the system resources. For details, see Resource Summary report. |
| Resource by User Report |
Displays details about resource usage by user. For details, see Resource by User report. |
| Resource by Project Report |
Displays details about resource usage by project. For details, see Resource by Project report. |
| Concurrency Report |
Displays concurrent resource usage by date. For details, see Concurrency report. |
| Host Activity Utilization Report |
Displays host usage by test runs. For details, see Host Activity Utilization report. |
| Elastic Docker Utilization report |
Displays Elastic Docker host usage by test runs. For details, see Elastic Docker Utilization report. |
| Elastic Cloud Utilization report |
Displays Elastic Cloud host usage by test runs. For details, see Elastic Cloud Utilization report. |
| Timeslot Usage Report |
Displays usage of resources associated with a timeslot. For details, see Timeslot Usage report. |
| Cloud Operations report |
Displays the provision and terminate operations on your cloud hosts. For details, see Cloud Operations report. |
Entity details menu
You can perform actions on an entity in Administration using the menu in the entity's details page.
To open the menu, click the Actions button  in the entity's details page. If a user type does not have permissions to perform specific actions, those actions appear dimmed.
The following table lists the actions that can be performed in each module.
| Module | Action |
|---|---|
| Hosts |
|
| Runs |
|
| Integrations |
|
| Orchestration |
|
| Cloud |
|
| Servers |
|
| Alerts | Delete Alert. Deletes the selected alert. For details, see Activate alerts. |
| Users | Delete User. Deletes the selected user. For details, see Delete users. |
| Projects |
|
Note: For the list of action you can perform from the entity details menu in Site Management, see Perform actions from the entity details menu.
Breadcrumbs
When you open the details page for an entity in a module, a breadcrumb is displayed at the top of the entity's details page.
You can use the breadcrumb menu to search for entities in the group by name (or ID for runs), and to switch between different entities in the group to view their details. To return to the entity group page, click the parent link in the breadcrumb.
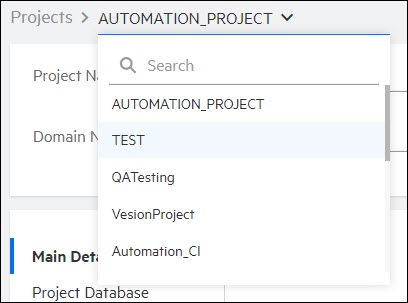
Note: Searches for an ID in the Runs module are performed using exact matches. All other searches are performed using partial matches (matching text in any part of the name).
 See also: