Share this page


Automation ROI
This topic describes the added value of automation, how to measure this value (Automation ROI), and how to track the effectiveness your automation.
In this topic:
- The benefits of Automation ROI analytics
- The Automation ROI widget
- Sample Automation ROI graph
- Set the scope
- Configure the metrics
The benefits of Automation ROI analytics
Software development companies acknowledge the need for automated testing, but recognize that it comes at a high cost. Setting up automation requires manpower hours and in some cases, the acquisition of software tools. Companies need a tool that can show the results of the investment in automation, and provide a way to determine the areas most worthy of investing more resources.
When implementing automation in a certain area, you expect to see improvements through several aspects such as:
- A reduction in the development cycle
- A reduction in the regression cost by shortening the regression cycle time
- Improve QA efficiency by eliminating the need to execute repetitive manual testing efforts
- Lower the risk level and improve the system's stability
In addition to the aspects mentioned above, one of the main automation ROI benefits is the early detection of defects. Tests that are part of an automated pipeline can detect defects at an earlier stage than manual or production tests. The earlier a defect is detected, the lower the development cost and the better return on investment (ROI) for your automation.
Using Automation ROI analytics, you can also understand in what areas should you invest efforts to obtain the highest ROI, and how you can determine its effectiveness.
How do I measure the automation ROI?
In order to understand the ROI for test automation, let us examine the objectives of automation:
- Automate manual regression tests in order to save repetitive manual execution of these tests every sprint or release
- Release software versions faster and more frequently
- Detect defects earlier in the software development lifecycle
- Increase coverage and as a result reduce risk level and defects leakage
ALM Octane's widgets and insight graphs address these objectives to help you determine the ROI of your automation. The ROI trend analytics reflect the automation ROI by measuring
- Investment in automation vs. the release speed
- Regression savings (saved manpower days over manual testing)
- Defect cost
- Escaped defects
How do I calculate automation coverage per area?
The widget configuration enables you to select a specific area in the product and define a filter for both manual and automated tests that you want to be included in this calculation.
To calculate the automation coverage, ALM Octane shows the automation coverage percentage increase/decrease for each release or sprint using the following formula: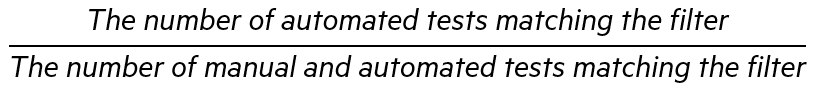

The Automation ROI widget
The Automation ROI widget provides a graph with several metrics that can help you determine the ROI: development speed, regression cost, defect cost, and escaped defects. These metrics are not intended to serve as a one-time score for a specific release or sprint, but rather reflect a trend of improvement, or ROI, by tracking the cost of defects over time.
Development cycle time metric
Good automation should help increase the development speed. This manifests itself in several areas, such as:
- Faster test cycles
- Immediate detection of defects
- Lower defect reopening ratio
The Automation ROI widget shows the trend of development speed by measuring the feature cycle time, and, if defined in the filter, per application module.
Regression cost metric
By investing in automation, you can reduce repetitive execution of manual regression tests and improve your testing strategy by allowing QA to focus on other essential tasks.
The Regression Cost metric shows the number of manual runs done per release compared with automation coverage in this area for the current release.
Defect cost metric
By comparing the number of defects detected early by automation (low cost defects) vs. defects submitted after manual runs (high cost defects), you can determine the cost of defects by examining the following factors. This metric is calculated using ALM Octane analytics.
- Defects detected by automation
- Code issues detected during automation. This value reflects code issues for which defects were not opened. If this metric has a high value, it may significantly affect your cycle time.
- Defects detected by manual runs
- % of defects with high detection time
Escaped defects metric
The Escaped defect metric reflects how many defects were missed by your testing activities. It also indicates whether your testing strategy is improving when you reduce the number of escaped defects that reach production. You can also configure the way in which to track escaped defects, for example, by the environment on which the defect was detected.
Sample Automation ROI graph
The Automation ROI graph allows you to see trends that affect your ROI.
The x-axis is the selected time frame, such as release or sprint.
The y-axis represents the percentage change of automated tests in a release, compared to the first selected release/time frame. This allows you to see the investment vs. value since you began automating your tests.
The coverage bar indicates the number of automated tests out of the total number of tests.
In the following example, as the percentage of automated tests increased, the key indicators improved.
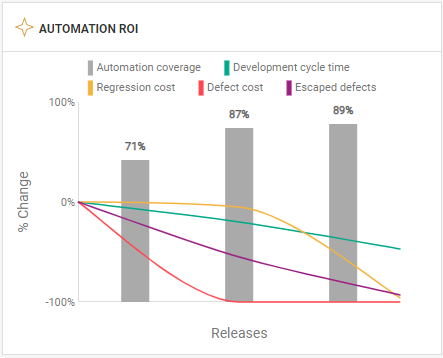
The percentages of the changes shown in the tooltip, compare the releases from the base point—the first release in which the key indicators had non-zero values.
For information about ROI insights and how to drill down further into the data, see Automation ROI insights.
The following metrics showed improvement in the later releases:
- Development cycle time. As the automation increased, there was an improvement in the development cycle time. Features were closed in less time since issues were detected at an early stage. Hover over a release to see the actual number of development days, as shown in this example.
- Regression cost. As the automation increased, the regression cost decreased. This metric shows the number of manual runs (based on the manual tests filter) executed per release. Hover over a release to see the actual number of manual runs, as shown in this example.
- Defect cost. As the automation increased, the defect cost decreased since defects were detected at an earlier stage.
- Escaped defect. As the automation increased, there was a reduction in the number of escaped defects.
Set the scope
To show an ROI graph on your dashboard, choose the Automation ROI widget from the widget gallery. To customize your graph, click the vertical ellipsis and select Configure.
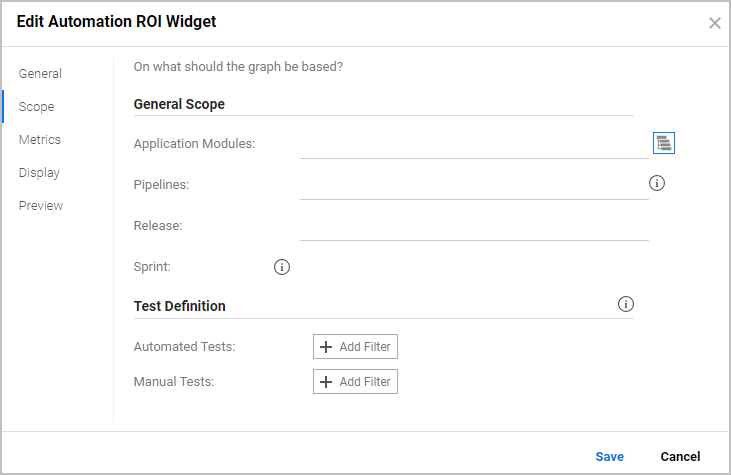
In the General Scope area, you indicate the application module, pipeline, and time frame, such as release and sprint, that you want to include in the calculation.
In the Test Definition area, you should include regression tests that are candidates for automation. We recommend not including acceptance tests, as they are not of primary relevance this calculation.
For example, you could apply the following filters:
- Automated Tests: Include in the Test level the System Test and Functional Test levels, but exclude Unit Test.
- Manual Tests: Set the Test type to End to End, Sanity, and Regression.
Descendant inclusion
To include all of the application module's descendants in the calculations, toggle the Descendants button:

|
Include only direct descendants |

|
Include all descendants |
The shortcut for switching between these options is Alt+i.
Configure the metrics
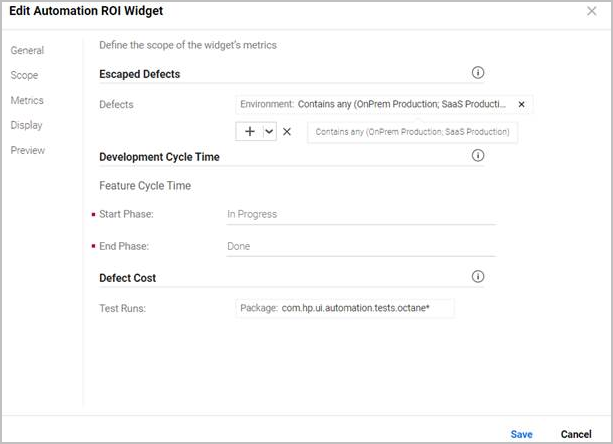
To customize and filter the metrics to be displayed b y the graph, click the vertical ellipsis and select Configure. Click Metrics.
In the Escaped Defects area, you set the filter for defects that escaped being reported as defects. For example, you can filter this metric by users.
In the Development Cycle Time area, you indicate the start and end phase for which to collect data. The defaults are In Progress and Done.
In the Defect Cost area, filter the test runs. For example, you can filter automated runs coming from a specific pipeline job or package.
 Next steps: