Share this page


Analyze release quality
This topic describes ways to analyze release quality.
Associate tests and defects with features
To enable optimal release quality analysis, ensure that you associate tests and defects with features, user stories, requirements, and defects, using:
-
The Backlog Coverage field in a test
- The Covered requirement field in a test
-
The Feature field in a defect
Analyze release quality using Backlog columns
Within the Backlog module, use different grid columns, including Defects, Risky commit count, Test coverage, and Automation coverage, to analyze the release quality.
The following table provides additional details:
| Column | Details |
|---|---|
| Test coverage |
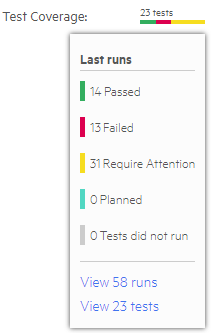
The Test coverage widget summarizes the last unique native run statuses for each run covering the feature. For details, see Test specific backlog items. Hover over the widget to open the detailed run results. Click the links to view a filtered list of the last runs and linked tests.
The covering tests can be broken down to direct and indirect tests. Direct tests are those that are linked directly to the feature. Indirect tests are those that have runs linked to the feature, but the test itself is not linked to the feature. For information on how to specify test coverage for specific backlog items, see Test specific backlog items. |
| Automation coverage |
The Automation coverage widget tooltip shows how much code of a backlog item (feature, user story, quality story, and defect) is covered by automated tests in different pipelines. This enables you to understand the number of code lines developed as part of each item, and to quickly see which areas of your development require additional automated test coverage. As a result, you can better estimate the quality and the risk of your newly developed features. ALM Octane tracks the lines correlated to each of the backlog items by analyzing both commit messages of users, and coverage information injected as part of each pipeline. Note: To enable this feature, on the pipeline's Details tab select the Track backlog items automation coverage checkbox. The widget tooltip shows the following:
|

Analyze test run results
On the Backlog module Overview tab, and the Dashboard module, view test run results by adding different widgets, including:
- Feature quality status
- Open defects by feature
- Defect daily injection
To see a specific epic or feature, select the node in the backlog tree. In the Dashboard, add a filter to display items relevant to your release.
Status and Native status
Charts and graphs based on test runs display only the following summarized run statuses: Passed, Failed, Planned, Skipped, and Blocked. Each individual, native test run status falls into one of these categories. This is for clarity of analysis.
-
Native status includes all the possible run statuses.
-
Status represents summarized statuses, used for reporting and coverage.
Each native status maps into a status.
Test specific backlog items
ALM Octane's default behavior is that test coverage is comprised of all last runs for all tests linked to the work item. If the same test covers two features, all of its runs will affect the status of both features.
If you are testing something specific such as a new feature, you can indicate which backlog items should be covered by the test run. In this case, when you view the Test Coverage after the run, the grid will only show those runs that covered your specific item.

Note: For automated runs initiated by a pipeline, the Backlog Coverage field is read-only. As a result, these runs cannot be marked as covering a specific work item.
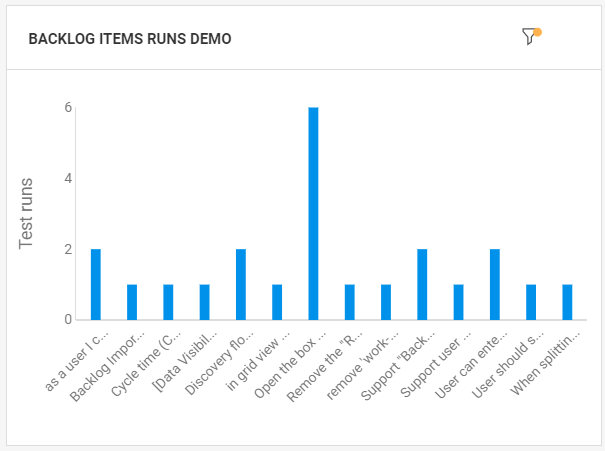
Display the test runs in the dashboard
After your run tests, you can create a graph of the runs that relate to the specified backlog items. The following example describes how to create a custom graph to show the last runs for the specified backlog item.
To create a custom graph:
-
In the ALM Octane banner, click the menu button and select Dashboard or select the Overview tab in the Backlog/Quality modules.
-
In the Widget Gallery, click Add custom graph.
-
In the General page, provide a name for the graph.
-
In the Scope page, in the Items type field, select Backlog's latest test runs.
-
In the Display page, choose Backlog items for the X-axis value.
-
Click Save to view a widget of runs per backlog item.
For details about configuring widgets, see Configure widget data settings.
Identify features at risk
In the Backlog module > Features tab, ALM Octane displays a risk icon ![]() for features associated with risky commits. You may want to increase testing on these features or postpone their release.
for features associated with risky commits. You may want to increase testing on these features or postpone their release.
For more details, see Identify risky commits and features at risk.
 See also: