Share this page


Pipeline status and trend - Overview tab
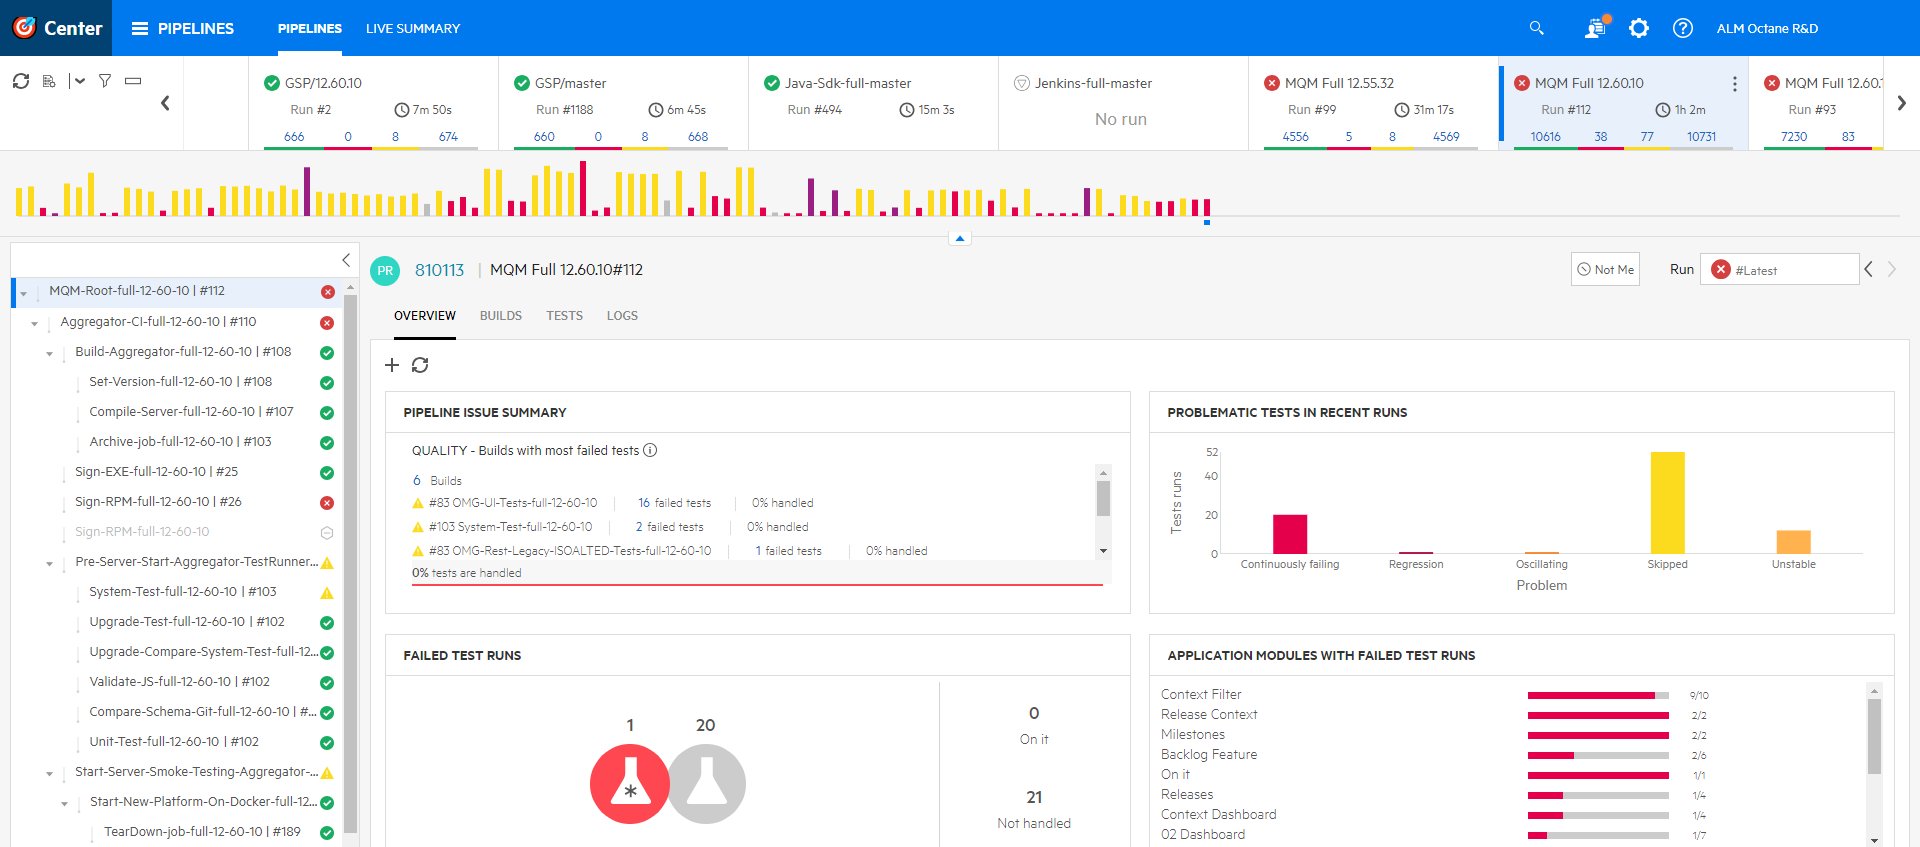
Use the Pipeline Overview tab to see the overall status and trend of your pipeline, and gain insights into what might be causing failures.
Pipeline overview widgets
Select a pipeline from the summary bar to see its overview data in the central pane.
Tip: If you do not see the Overview pane, select the pipeline root node in the tree view.
The Overview widgets show summary information about the selected pipeline's latest or most recent pipeline runs. By default, the dashboard shows how many failed tests and builds are currently being investigated, which tests are problematic, and which application areas are affected.
Click the Add Widget button  to add other widgets from the DevOps & Analytics widget gallery or create your own widgets. For example, you could add widgets that show code coverage per package and file, as well as code coverage trends over time, based on code coverage reports from Jenkins. For details, see Track code coverage in pipeline runs.
The Overview tab includes the following.
| Area | Description |
|---|---|
| Pipeline issue summary |
Displays the most critical problems in the selected pipeline so you know what to fix first. This includes information regarding failed tests, problematic tests, build failure classification, related committers, and more. This data is then used to give CI owners actionable information, to fix failed pipelines quickly. For details, see Pipeline Issue Summary cards. |
| Application modules with failed test runs |
Displays which application modules have the most failing tests. Lists the application modules currently associated with automated tests that failed in this pipeline run. The widget shows how many of the tests assigned to the application module failed. Note: To use this widget, automated tests must be assigned to application modules. For details, see Assign items to application modules. |
| Failed builds classification |
Displays the number of failed builds included in this pipeline run, broken down by type of failure. You can also see how many of the failures are currently assigned to someone for investigation. To use this widget, failed builds must be classified in the Builds tab. Classification can be handled automatically, or manually, based on your own failure analysis. For details, see Analyze build failures. |
| Application modules affected by commits |
Displays the number of application modules that were affected by the commits in the selected pipeline run, as well as the number of defects, quality stories and user stories affected by the commits. Click the number of application modules to drill to the relevant details. |
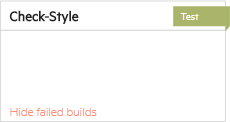
Tip: Some builds might not be included. You can configure hiding build failures resulting from specific pipeline steps. For details, see Ignore or hide results of specific steps.
To check whether a step's builds are hidden, look at the step in the pipeline's Topology tab:

Track code changes
If your CI server is set up to work with an SCM system, open a pipeline run to see commit changes and backlog items associated with that run.
Based on the SCM data, you can analyze the effects of the changes on your product and identify hotspots in your code. Hotspots are sensitive areas of code that are risky to change.
For details, see Track commits to your SCM system.
Pipeline Issue Summary cards
Summary cards show information regarding failed tests, problematic tests, build failure classification, related committers, and more. The Pipeline Issue Summary cards give CI owners actionable information to fix failed pipelines quickly.
The pipeline failures are categorized into the following types: Compilation, Environment, Quality, or Security issues. The cards for each of these are displayed in order of urgency. Each card shows you the problem and its root cause, the users directly related to the problem, and the percentage of issues being handled. This information tells you if a problem needs immediate attention and whom to contact in order to deal with it.
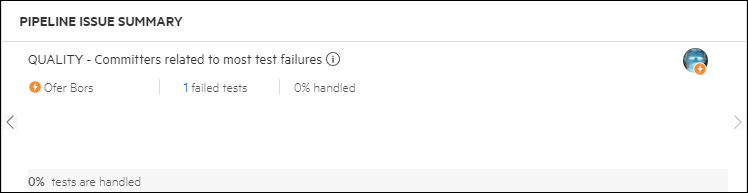
The card indicates the percentage of builds that have someone assigned in the Assigned to field, indicating that the problem is being handled. Related users includes anyone who may have caused the issue, generally committers in the pipeline run, as well as anyone assigned to the compilation build.
Note: To provide data for some of the Pipeline Issue Summary cards, you need to manually classify failed builds. For details, see Build failure classification.
The following table provides details about the pipeline failure categories.
| Failure category | Description |
|---|---|
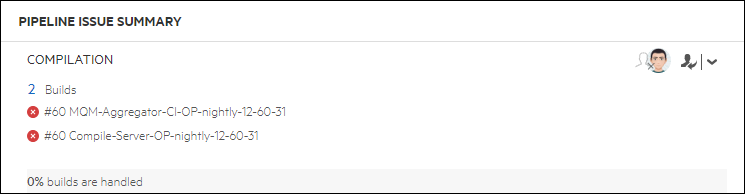
| Compilation |
Compilation issues include any failure with at least one build which failed due to compilation issues. For each build that was classified as a compilation issue, the card shows if it failed in an earlier run, so that you know when the failure started.
|
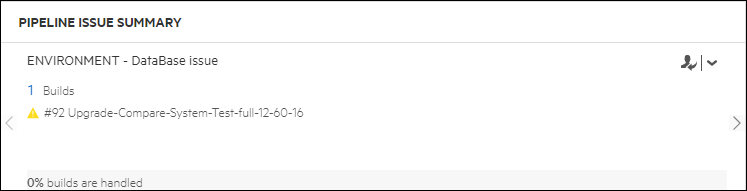
| Environment |
Environment Issues include any build failures classified as Environment issues. The cards are divided into subgroups based on the preconfigured tags (such as Environment - Database, and Environment - Network), or custom tags you added. Each card shows all the problematic jobs in the relevant category, with the oldest jobs listed first.
|
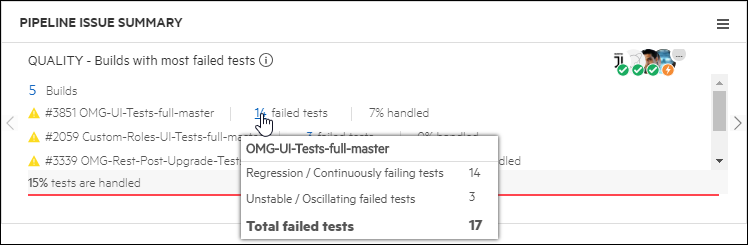
| Quality |
If any tests failed in a pipeline run, and the build is not classified as a compilation or environment issue, a Quality Issue card is displayed. The cards are divided into two types:
Tip: Admins can define a percentage threshold that determines which test failures are displayed on the card. For details, see the FAILURE_ANALYSIS_INSIGHT_TEST_FAILURE_THRESHOLD configuration parameter under FAILURE_ANALYSIS_INSIGHT_TEST_FAILURE_THRESHOLD. |
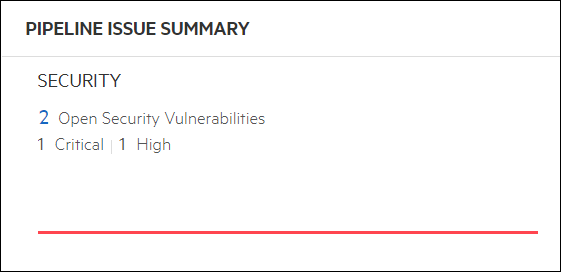
| Security |
If your pipeline collects security testing results, you can see the number of open vulnerabilities found in the scan triggered by the selected pipeline run, as well as their severities. Open vulnerabilities are those whose state is not Closed or Not an issue. Click the number to open the Vulnerabilities tab for the pipeline run. For details, see Track security vulnerabilities.
|
 See also: