Share this page


Define a trend report
This section explains how to define a trend report to compare performance test run data over time.
Tip: See the LoadRunner Enterprise video gallery for a video on how to use Trend reports.
Define a trend report
This section describes how to configure a trend report.
-
Prerequisites.
Make sure there is a data processor present in your project pool (required for adding test runs to the trend report). For details, see Add a host pool.
-
Open the Performance Trending page.
In the LoadRunner Enterprise masthead, click the module name or the dropdown arrow and select Performance Trending (under Analysis).
-
Define a new trend report.
-
On the Performance Trending page, click Create Trend Report
 .
. -
Enter a name and description (optional) for the report and click Create.
Tip: You can add or modify a description at any time by clicking Trend Report Description
 in the trend report details page, and entering a description in the box. You can modify a report name by moving the cursor over the report title, clicking Edit
  , and changing the title as required.
-
-
Add performance test run data to the report.
-
Click Add Runs and select a project and test set. All analyzed instances of the performance test appear in the grid.
You can click the Filter
 button to filter the list of runs displayed, or right-click a column heading to sort or group runs displayed in the runs grid. For details, see Personalize your display.
 -
Select the analyzed instances of the test that you want to add to the trend report.
Note:
-
The process whereby LoadRunner Enterprise extracts the performance test data from Analysis is very labor intensive on the data processor, and may take anywhere from several minutes to over an hour. We recommend that you use a machine dedicated for this purpose.
-
LoadRunner Enterprise extracts the performance test data from Analysis using a granularity of 16 seconds. This value might be different from the defined granularity in Analysis, and may lead to slight variations when comparing values between Analysis and LoadRunner Enterprise.
-
-
By default, data collected from the whole test run is available for trending. To make only part of the test run available for trending, click
 Time Range, and select Trend Part of Run.
Select the part of the run to trend by entering the start and end times in the Start Time and End Time boxes, and click OK.
To revert back to the default setting, select Trend complete run.
-
Click Add or Add & Close. LoadRunner Enterprise uploads the test runs from Analysis and adds them to the trend report. The trend report opens displaying the Trend Overview tab.
-
-
View trend report data.
For details, see View and manage test runs in a trend report.

View and manage test runs in a trend report
This section explains how to view and manage the test runs trended in the report from the Trend Overview tab.
View test runs in a trend report
-
In the Trend Reports grid, click the name of a report to open. The Trend Overview tab is displayed.
-
The trended runs table displays information for all trended test runs in the report. The purpose of this section is to provide you with basic overview trending information without having to open a trend view. It is divided into the following sections:
General Details Columns in this section display general information relating to the test run.
Workload Characteristics Columns in this section are intended to display enough information in order for you to identify whether the test runs are similar enough in terms of workload, and therefore suitable for trending.
The values displayed in this section are relevant only for the selected time range. Changing the selected time range is likely to lead to different results.
Performance Overview Columns in this section contain information relating to the overall performance of your application.
The basic trend information is shown by upward or downward arrows that indicate performance improvements or regressions with regards to the baseline only.
-
You can change the comparison method displayed in the trend view by toggling the Compare to baseline / Previous button. The selected comparison method is saved for the next time you open the report.
For details on comparison methods, see Comparison methods to identify trends.
-
You can use the filter
, sort  , and
, and  to select the columns you want to view in the Trended Runs table. Details of the available columns are listed in the tables below:
 General Details
The table below describes the columns in the General Details section of the Trend Overview tab.
UI Elements
Description
ID The run ID.
Test Name The name of the test.
Date The date of the performance test run.
State Indicates whether the test run was successfully published and added to the report: Trended or Not Trended respectively. A test run that was not successfully added appears in red and a tooltip displays the reason.
If the State is Not Trended, the reason for this error appears in this field. A link appears to republish the run after you have fixed the error.
Duration The duration of the test run, in minutes.
Trended Range The time range within the test run that is selected for trending.
Total Vusers The number of Vusers in the test run, within the selected time range.
Run By The name of the user who ran the test.
Project The name of the project in which the test was run.
Workload Characteristics
The table below describes the columns in the Workload Characteristics section of the Trend Overview tab.
UI Elements
Description
Total Vusers in Trended Range (Trended Vusers) The maximum number of running Vusers within the trended time range.
Total Number of Transactions (Transactions) The total number of transactions in the test run that passed, failed or stopped within the selected time range.
Passed Transactions per Second (TPS) The number of transactions that passed per second of the test run within the selected time range.
Total Hits (Hits) The total number of hits per second within the trended time range.
Total Throughput (Throughput) The total throughput within the trended time range.
Passed Transactions per Minute (TPM) The number of transactions that passed per minute of the test run within the selected time range.
Hits per Second (HPS) The average number of hits per second within the trended time range.
Throughput per Second (Throughput per Sec.) The amount of throughput per second within the selected time range.
Performance Overview
The table below describes the columns in the Performance Overview section of the Trend Overview tab.
UI Elements
Description
Transaction Success Rate (Success) The percentage of the total number of transactions that passed within the selected time range.
Errors per Second (EPS) The average number of errors per second within the selected time range.
Passed Transactions (Passed) The actual number of transactions that passed within the selected time range.
Failed Transactions (Failed) The actual number of transactions that failed within the selected time range.
Total Errors (Errors) The total number of errors within the selected time range.
Manage test runs in a trend report
You can perform the following actions on test runs from the Trend Overview tab:
| Action | Description |
|---|---|
| Add additional runs to a report |
Click For details, see Add performance test run data to the report..
|
| Remove runs |
Select the test runs you want to remove from the trend report, and click |
| Set run as the baseline |
Select the test run to use as the baseline run for comparing test runs, and click The selected baseline test run is indicated by the |
| Change the position of a run |
Select a test run and drag and drop it to the selected position in the Trended Runs table. Note: Changing the position of the test run may have an effect on the comparison value when the Compare to Previous method is selected. For details on comparison methods, see Comparison methods to identify trends. |
| Redo Publish |
To republish results to a trend report, right-click the test run that you want to republish results, and click This is only available for runs that failed to trend. |
| Set run label |
To enable easy identification when measuring transaction response time, click Set Run Label in the Trend Overview toolbar, and enter new names for the runs in the Run Label box. The run labels are displayed in the widgets. |
| Export to Excel |
To export the test run details to an Excel file, click Export to XLS |
 in the Trend Overview toolbar or context menu.
 Set Run as Baseline in the Trend Overview toolbar or context menu. For details on comparison methods, see
  .
. . The Excel file is downloaded to the Downloads folder of the client user.
Add trend view categories
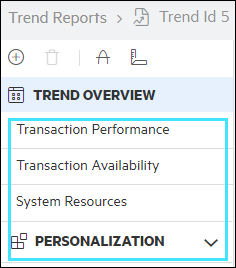
A trend view is a display item that presents trending information for a particular performance metric, for example, transaction response time.
A report automatically includes the default trend view categories (Transaction Availability, Transaction Performance, and System Resources), and any customized categories that you choose to add.
Tip: If you delete any of the default trend view categories, you can always restore them by clicking Add Category ![]() and selecting the deleted categories from the Default Defined Categories list.
and selecting the deleted categories from the Default Defined Categories list.
To add trend categories to a trend report:
-
In the Trend Reports grid, click the name of a report to open. The trend view tabs are displayed below the Trend Overview tab.
-
To add a category, click Add Category
and enter a name for the category. -
Click Add. The category is added to the Personalization tab.
-
Select a category, click Add Widget
, and select the trend view widgets to include:Transactions Trend measurements related to transactions.
-
Transaction Response Time. Trends average and 90% response time values.
-
Transaction Pass/Fail Summary. Trends number of pass, fail, and stopped transactions.
-
Transaction per Second. Trends average transaction per second.
-
Transaction Percentiles. Trends median, 75%, 90%, and 95% response time values.
Monitors Trend measurements related to monitors.
-
System Resources CPU Utilization. Trends average CPU utilization of monitored application under test machines.
-
System Resources Disk Utilization. Trends average disk utilization of monitored application under test machines.
-
System Resources Available Memory. Trends available megabytes of monitored application under test machines.
Other Trend measurements other than transactions and monitor measurements.
-
Web Resources. Trends average hits per second and throughput overlaid with maximum running Vusers.
-
Errors Statistics. Trends average number of errors per second.
-
Customize your own widget. Included in this section are three basic non-configured trend views, each one based on one of the trend view display options. You can select one of these trend views and customize it as desired. For details, see Customize your own widget.
Note:
-
You can only select widgets for which you have related measurements; all other widgets are unavailable.
-
For all widgets except Customize your own widget, you can only add measurements that are related to that widget.
-
-
For each widget, click the Layout Reorder
 button and select the appearance of the trend view. The available settings are:
Grid. This view is best suited for displaying comparisons between measurements. You can view threshold settings in this view only. For details, see Display Setting: Grid.

Line Graph. This view is best suited for displaying trending information graphically over a timeline. For details, see Display Setting: Line Graph.

Stacked Graph. This view displays trending information graphically over a timeline. It is best suited for trending a small number of multiple measurements. For details, see Display Setting: Stacked Graph.
Display Setting: Grid
This section explains the Grid trend view display setting. You can view threshold settings in grid view only.
Move the cursor over the grid to view the measurement values.
UI Elements
Description
<Measurement value name> The name of the measurement value being trended. For example, minimum, maximum, or average.
<Measurement value> The actual value of the measurement being trended, and its comparison value, displayed per test run. For details about comparison methods, see Trend reports.
Name The name of the measurement being compared.
Type The type of measurement being compared.
Display Setting: Line Graph
This section explains the Line Graph trend view display setting.
Move the cursor over the graph to view the measurement values.
Note:
-
When you hold the cursor over the line graph, a tooltip appears displaying the exact number of units for that measurement, correct to the nearest test run on the timeline. In other words, if you hold the cursor near the left point of the line graph, you see the value of the first test run.
-
When you click a section in the line graph/measurement in the legend, it becomes highlighted, as does the corresponding section in the legend/line graph.
User interface elements are described below (unlabeled elements are shown in angle brackets):
UI Elements
Description
<graph slope> The upward or downward slope of the line represents an upward or downward change in the measurement's unit. For example, a higher transaction response time (which is a performance regression), or a higher transactions per second value (which is a performance improvement).
<x-axis> Lists the test runs according to their run date.
<y-axis> The relevant unit of measurement.
Example: For the Transaction Response Time measurement, the y-axis values represent seconds, while for the transactions per second measurement, the values represent the number of transactions.
<Measurement name> The name of the measurement.
All measurements are displayed by default. To hide a measurement in the graph, click the measurement's name in the legend; the measurement is grayed out. Click the measurement name again to make the measurement visible and the color of the measurement is restored.
Hover the cursor over a measurement in the legend to highlight the measurement in bold in the graph.
Type Contains an acronym that identifies the measurement type. For a full list of available acronyms, see Measurement acronyms.
Function Displays the value of the measurement being trended.
Display Setting: Stacked Graph
This section explains the Stacked Graph trend view display setting.
Move the cursor over the graph to view the measurement values.
Note:
-
If different values are selected for the same measurement (for example, Maximum and Average transaction response times), then the measurements appear as stacked bars. That is, the values appear above each other for the bar that represents the transaction response time measurement for a specific test run.
-
When you hold the cursor over a bar, a tooltip appears which displays the exact number of units for that measurement, correct for that test run.
-
When you click a section in the bar chart/measurement in the legend, it becomes highlighted, as does the corresponding section in the legend/bar chart.
User interface elements are described below (unlabeled elements are shown in angle brackets):
UI Elements
Description
<bar height> The height of the bar represents the change in the measurement's unit. For example, a higher transaction response time, which represents a performance regression, or a higher transactions per second value, which represents a performance improvement.
<x-axis> Lists the test runs according to their run date.
<y-axis> The relevant unit of measurement.
Example: For the Transaction Response Time measurement, the y-axis values represent seconds, while for the transactions per second measurement, the values represent the number of transactions.
<Measurement name> The name of the measurement.
All measurements are displayed by default. To hide a measurement in the graph, click the measurement's name in the legend; the measurement is grayed out. Click the measurement name again to make the measurement visible and the color of the measurement is restored.
Hover the cursor over a measurement in the legend to highlight the measurement in bold in the graph.
Type Contains an acronym that identifies the measurement type. For a full list of available acronyms, see Measurement acronyms.
Function Displays the value of the measurement being trended.
Scale Indicates the scale of the measurement. When viewing information in the line graph view, you can adjust the scale of any measurement to make comparing measurements more meaningful.
To change the scale of a measurement, click the value in the column and select the desired scale from the Set Scale box that opens. You can also apply the selected scale to all the measurements in the graph.
-
-
You can configure the widget layout by clicking View
 on the right-side of the custom view, and selecting one of the layout options:
Vertical. The views are stacked in a vertical layout. 
Mix. The first view is stacked in a vertical layout, and additional views are arranged below it in a horizontal layout. 
Horizontal. The views are arranged in a horizontal layout. -
You can edit the display and comparison settings for default and custom trend views by clicking More
 in the trend view toolbar. For details, see Configure trend view settings.
Define trend thresholds
You can set trend thresholds to define which percentage differentials between measurements constitute significant improvements or regressions in performance. The threshold definition is applied on a global level and holds true across all trend views in the report. For more details and an example, see Trend thresholds.
To define trend thresholds:
-
In the Trend Reports grid, click the name of a report to open.
-
In the trend view toolbar, click Trend Thresholds
 .
. -
In the Threshold Settings dialog box, set the thresholds to be used for identifying performance improvements and regressions. Select from the following measurement types:
Transaction Response Time (TRT) Measures whether the average transaction response time of the transactions over a specified time interval exceeds the defined threshold. Transactions per Second (TPS) Measures the number of times a transaction was executed in a second. Transaction Summary Pass (TRS) Measures the actual number of transactions that passed within the trended time range.
Transaction Summary Fail (TRS) Measures the actual number of transactions that failed within the trended time range.
Total Errors (ERR) Measures the total number of errors within the trended time range.
Errors per Second (EPS) Measures the average number of errors per second within the trended time range.
Hits (WEB) Measures the total number of transaction hits to the web server within the trended time range.
Throughput (WEB) Measures the total throughput to the web server within the trended time range.
-
Enter the percentage differential between instances of the measurement that are considered an improvement, a minor regression, and a major regression in performance.
Define and customize mapped measurements
You can map measurements with different names to a new single measurement which you create.
To define and customize mapped measurements:
-
In the Trend Reports grid, click the name of a report to open.
-
In the trend view toolbar, click Custom Measurement Mapping
 .
. -
In the Custom Measurement Mapping dialog box, click Create Mapping
.A table which lists all the test runs in the trend report is displayed. The runs appear in the same order as they appear in the Trend Overview tab.
-
Enter the name and description of the new mapped measurement, and in the Data field, select the data type: Transaction or Monitor.
-
In the Type field, select the measurement type: TRT, TPS, or TRS for a transaction, and UDP for a monitor.
-
Select a test run, and click in the Transaction/Monitor Name field to select which measurements to map to the new mapped measurement.
If you want all future instances of the measurement to automatically be mapped to the current setting, select a default transaction or monitor name in the Default Transaction/Monitor Name field and click Apply to all Runs.
To see a visual comparison in the data grids if TRS is selected, add a "pass" or "fail" suffix to the mapping name.
Configure trend view settings
You can edit the trend view's display and comparison settings by clicking More ![]() in the trend view toolbar (not available in the Trend Overview tab).
in the trend view toolbar (not available in the Trend Overview tab).
You can perform the following actions for default and custom views:
| Action | Description |
|---|---|
|
View in full screen mode |
Select Full Screen Press |
|
Change the display view |
Select Display View, and choose a view type:
|
|
View the display legend (Line graph only) |
Toggle the Legend - Show/Hide button to show or hide the measurements legend. |
|
Show value differences (Grid view only) |
Toggle the Differences - Show/Hide button to show or hide value differentials between test runs. We recommend hiding differences when exporting the report to a CSV format. Toggle the Differences - Percentage/Value button to define how to display value differentials between test runs in the trend view - as values or as percentages. |
|
Rename custom trend view tabs or widget title |
|
 to display the graph in full screen mode.
 You can perform the following actions for custom views only:
| Action | Description |
|---|---|
|
Select measurements |
Select Configure Measurements and choose measurements to add to the trend view. For all widgets except Customize your own widget, you can only add measurements that are related to that widget. For details, see Select measurements. |
|
Select runs to display |
Select Runs Selection and choose the test runs to include in the trend view. |
| Delete a widget |
Select Delete This Widget. The selected widget is deleted from the trend view. |
Customize your own widget
You can select a blank trend view and customize it as desired by adding measurements to it. This enables you to map measurements with different names to a new single measurement which you create.
To add a customized trend view:
-
In the Trend Reports grid, click the name of a report to open. The trend view tabs are displayed below the Trend Overview tab.
-
Click Add Category
and enter a name for the category. -
Click Add. The category is added to the Personalization tab.
-
Select Customize your own widget, and choose a view:
Grid. Blank table view. Use Select Measurements dialog to customize it after adding it.
Line Graph. Blank line view.
Stacked Graph. Blank stacked column view.
Note: We recommend using this view when trending up to 5 measurements in a single view.
-
-
Click Configure Measurements, and select the measurements to add for the selected group. For all widgets except Customize your own widget, you can only add measurements that are related to that widget.
-
In the Select Values to Trend section, select the values of the selected measurement to include in the trend view.
-
You can use regular expressions to define a rule that automatically selects measurements to be included in the trend view. To do so, click Edit Automatic Selection Rules and add regular expression rules. The automatic selection rule applies to measurements that are currently displayed in the trend report data, as well as any future measurements.
-
Export trend report to a PDF
You can export a selected trend report to a .pdf file.
- In the Trend Reports grid, click the name of a report to open.
-
Click Export report to PDF
 .
. -
In the details section at the top, enter the report title, author, role, and organization.
-
Select various items to include in the report:
Include Logo Enables you to set the image that is placed on the cover page of the report and at the top of each page of the report.
Title Page Enables you to include a cover page for the report.
Table of Content Enables you to include a table of contents in your report.
-
Select the content to include in the report, and then click Export.
Include All Content Includes data from all the default and personalization categories that display trending information from the point of view of quality attributes:
-
Default Categories:
-
Trend Overview. Displays information from the Trend Overview tab (General Details, Workload Characteristics, Performance Overview).
-
Transaction Performance. Transaction Response Time (compared to baseline).
-
Transaction Availability. Transaction Pass/Fail Summary (compared to baseline).
-
System Resources. CPU utilization, Disk utilization, Available memory.
-
-
Personalization Categories: Any custom trend view categories that you add to the report. For details, see Add trend view categories.
Threshold Settings Includes threshold measurements. For details, see Define trend thresholds.
Terminology Includes measurement acronyms used in the report. For details, see Measurement acronyms. -
 See also: