Share this page


Detect anomalies
This section describes anomaly detection, which enables you to quickly, intuitively, and effectively identify abnormal application behavior in performance tests.
Anomaly detection overview
Anomaly detection insights speed your investigation into system performance, and help determine the root cause of detected deviations. You can view anomalies in real-time while a performance test is running, or after a test run has finished in the offline view.
LoadRunner Enterprise uses an algorithm to determine when an anomaly has occurred. The algorithm is split into two main parts:
-
Detecting if a point in a series is abnormal, relative to other points.
LoadRunner Enterprise uses a statistical assumption that the series approximately follows a normal distribution, and deviates in a standard manner over time.
For every measurement, it continuously calculates the mean and standard deviation. Then, for each point, weighted versions of the mean and standard deviation (which give higher priority to more recent points) are calculated. These weighted results are used to create the sleeve. The sleeve is then 6 “weighted standard deviations” around the “weighted mean” of the measurement.
Every point in the series that is above, or below the sleeve, is considered abnormal.
-
Notifying the user when a measurement behaves abnormally within a certain time range.
Not all deviations from the sleeve are considered anomalies; only when a measurement deviates from the sleeve for a significant period of time.
LoadRunner Enterprise determines this by keeping a baseline of the last 30 points for each measurement. Each point that deviates from the sleeve is given a value of 1, and 0 if it is inside the sleeve. For example, a measurement with a baseline sum of 0 means that all points are in the sleeve, whereas a baseline sum close to 30 means that most points are deviating.
LoadRunner Enterprise notifies the user of an anomaly when the baseline sum for a measurement is above 18 (this means that 60% of the points in the baseline are above or below the sleeve).
Note: LoadRunner Enterprise gives more weight to measurements with a baseline that has consecutive deviations (0000011111) than to an unstable baseline (0101010101). This is because measurements that spike are not deviating in a standard way, and are more likely to result in false-positive notifications.
Detect anomalies in graphs
This task describes how to detect anomalies during a performance test run.
Note: Granularity options differ depending on whether you are viewing graphs during runtime or in offline view. In offline view (available in online and offline graphs), you can select any granularity range down to a minimum of three minutes. In runtime view (online graphs only), you are limited to several predefined granularities.
-
Open the online graphs pane in the lower section of the Performance Test Run page. For details, see Graphs view.
To detect anomalies in offline results, open the offline results view. For details, see View finished test run results offline.
-
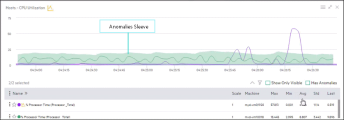
Identify monitors that encountered anomalies.
-
In the Graphs pane, identify the monitors that encountered anomalies (indicated by a warning icon
 ).
). -
Click a graph that has an anomaly.
-
-
Identify and analyze the metric-anomalies.
-
Click
 Configure > Show Anomalies to identify plot bands which indicate where anomalies occurred.
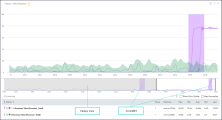
-
Click a plot band to zoom in on the metric-anomaly in the graph.
Alternatively, drag the slider in the timeline to focus on the time period when the anomaly occurred.
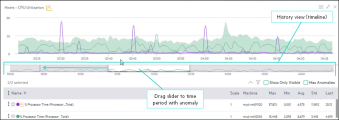
Tip: You can pull the sliders on both sides to adjust the date range displayed in the graph. You can also move the selection (maintaining the same granularity), and select a new range by clicking on an area that is not part of the selection and dragging.
-
(Optional) Use the graph legend to display measurements that encountered an anomaly.
To filter the legend for measurements that have an anomaly, select Has Anomalies, and then click the measurements you want to view in the graph (a maximum of 20 measurements can be displayed).
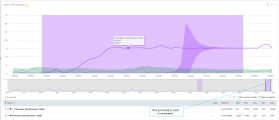
To focus on one or several measurements that encountered an anomaly, select Show only me in the
 Measurement Options menu (for several measurements, use this option for the first measurement, and then select the other measurements).
You can also see the expected range for a measurement by clicking a specific measurement in the legend or in a graph, or by selecting Show/Hide Anomaly Sleeve in the
Measurement Options menu in the expanded view. For user interface details, see Evaluate a test's status or Graphs view.
Note: While anomalies should be apparent in the runtime view (the plot band is not available), we recommend using the offline view because the runtime view only shows anomalies that have occurred in the time frame when the granularity is set to Last 3 minutes.
-


 See also: