
Share this page


Dynamic graphing
Dynamic graphing enables you to view graphical relationships between applications and between processes, and to create an application set from a group of displayed applications.
Note: As Internet Explorer 11 has ended support, PPM replaced the Silverlight plug-in. Because of this, the following previous function is not supported:
- Some operators and wildcards used in text data type filter fields are not supported. For details on the currently supported operators, see Operator descriptions and examples.
Start dynamic graphing
You start dynamic graphing in either of the following ways, depending on the entity relationships you want to view:
| Option | Details |
|---|---|
| View graphical relationships between applications in an application set or between related processes |
To view graphical relationships between applications in an application set or between related processes:
|
| View graphical relationships between selected entities |
To view graphical relationships between the entities you select from the results of a search, or between the entities you select from an entity group:
|
Tip: To zoom in and out of a displayed graph, use the Zoom In/ Zoom Out buttons at the bottom of the screen, or use the scroll wheel on the mouse.

View application relationships
You can use dynamic graphing to view the application relationships, including:
- The applications in an application set.
- The number of process that an application supports.
- The dependencies between applications.
- The dependencies an application set has between all applications, including applications not included in the application set.
To view application relationships:
-
Start dynamic graphing. For details, see Start dynamic graphing.
-
Click Application Set and then select the target application set. The applications in the application set are displayed.
-
Do the following:
Option Details View the dependent processes an application supports To view the number of processes that an application supports, from the option bar, select Load Supported Process
 .
. The size of the rectangles change proportionally, based on the number of processes supported. The number of processes supported is displayed in the lower right corner of the rectangle.
View application dependencies To view dependencies between applications in an application set:
- From the option bar, select Graph Options
 .
. - Select Show Upstream/Downstream.
-
To view the dependencies between directly related applications, select Show Direct Dependencies.
The applications in the current application set are represented by blue rectangles. Applications that have a direct dependency on one or more of the applications in the current application set and are not part of the application set, are represented by green rectangles.
View details of an application To view the details of an application, click the application. The information is displayed on the Details table.
If you have loaded the supported processes of the displayed applications, an additional table, the Process Dependent(s) table, is displayed in the Details table. The Process Dependent(s) table displays a list of the dependent processes that are supported by the applications in the application set.
- From the option bar, select Graph Options
View process relationships
You can use dynamic graphing to view process relationships, including the selected process and its child processes (if any), the number of applications supporting the process, and the applications that support the process.
To view process relationships:
-
Start dynamic graphing. For instructions, see Start dynamic graphing.
-
Click Process Tree and then select the target process. Processes are displayed on the right, as green rectangles.
-
Do the following:
Option Details View the number of applications supporting the process To view the number of applications that support the process, from the option bar, select Load Related Applications
. The size of the green rectangles change proportionally, based on the number of applications that support the process. The number of applications supporting the process is displayed in the lower right corner of the rectangle.
View details of a process To view the details of a process, click the process. The information is displayed on the Details table.
If you have loaded the related applications of a process, an additional table, the Application Dependent(s) table, is displayed under the Details table. The Application Dependent(s) table lists the applications that support the process.
Filter applications and processes
You can filter the graph to highlight only the applications or processes that meet certain criteria.
To filter applications and processes:
-
Start dynamic graphing, and then open an application set, or one or more applications or processes. For details, see Start dynamic graphing.
-
Click Filter Graph
 to open the Filters table.
 -
Select the attribute on which you want to filter and enter a value in the Criteria column. Filter criteria are not case-sensitive. You can use operators for number and date data types. For details, see Operator descriptions and examples.
Note: To configure attributes (fields) that have selectable "yes" or "no" values when the entity was created, such as the Compliant attribute of a process entity and the Under Maintenance attribute of an application entity, enter y or n (not yes or no) as the filter criteria value.
 Operator descriptions and examples
Data type Operator Description
Text Contains Enter the search string in the filter field to match all the texts that contain the search strings entered.
Example:
-
test
Match all the texts that contain "test", such as "test1" and "QA Test".
Number/Date > (Greater Than) Match all the values greater than the given value, or all the dates earlier than the given date.
Examples:
-
>25
Match values that are greater than 25 such as "26" or ""27".
-
>2022-12-01 00:00:00
Matches all dates that are later than December 1, 2022, such as January 1, 2023.
< (Less Than) Match all the values less than the given value, or all the dates earlier than the given date.
Examples:
-
<25
Match all values that are less than 25, such as "24" or "23".
-
>2022-12-01 00:00:00
Matches all dates that are earlier than December 1, 2022, such as January 2, 2022.
= (Equals Sign) Explicit match.
Examples:
-
=25
Match the value of 25.
-
=2022-12-01 00:00:00
Match the date of December 1, 2022.
- (Dash) Match any value in the given range of numbers, or any dates in the given range of dates.
Note: To match dates in the given range of dates, make sure to add a space between each date and the operator.
Example:
-
23-25
Match values of "23", "24", or "25".
-
2022-12-01 00:00:00 - 2023-02-01 23:59:59
Match dates between and including December 1, 2022 and February, 2023.
-
-
Click Apply.
Applications or processes that do not meet the filter criteria are changed to gray rectangles in the graph.
Change dynamic graphing display of applications
You can change the dynamic graphing display of applications by changing the color or size of the nodes. The color or size of the nodes represents the number or value of a selected application attribute.
Overview
You change the dynamic graphing display using the following options:
| Option | Description |
|---|---|
| Change the node color |
Use color coding and color percentiles to specify the range of quantities or values that a color represents. Color coding includes up to four colors, with up to three colors based on specified percentiles:
Percentiles are based on the highest configured value or number of the selected attribute (in the Color Nodes By field) for the applications in the graph. For example, an application score can range from 0 to 5, however, if the highest application score of all applications in the graph is 4, the percentiles are based on the value of 4 (not 5). |
| Change the node size | Use different sizes of nodes to show the number or value of a selected application attribute. The larger the node is, the larger the number of value is. |
Example: The following table shows an example of percentile values for application scores. The highest attribute value is the highest application score of all applications in the graph (each row represents a separate graph) and the high percentile is set to 80% and the low percentile is set to 20%.
| Highest attribute value | Values for Percentile Ranges of 80% and 20% | ||
|---|---|---|---|
| 100% >= Pink >= 80% | 80% > Orange >= 20% | 20% > Light Blue | |
| 5 | 5 >= Pink >= 4 | 4 > Orange >= 1 | 1 > Light Blue |
| 4 | 4 >= Pink >= 3.2 | 3.2 > Orange >=0 .8 | 0.8 > Light Blue |
| 3.5 | 3.5 >= Pink >= 2.8 | 2.8 > Orange >= 0.7 | 0.7 > Light Blue |
Change dynamic graph display
To change the dynamic graph display of applications:
-
Start dynamic graphing. For details, see Start dynamic graphing.
-
Select an application or a process.
-
Click Visual Options
 to open the Graph Visual Options window.
 -
To color the nodes:
- From the Color Nodes By drop-down list, select an application attribute that the node color represents.
- Adjust the Color Percentiles by entering the percentile ranges. If you want to represent only high and low quantities or values, set percentile ranges to successive numbers, such as 51 and 50.
-
To size the nodes, from the Size Nodes By drop-down list, select an application attribute that the node size represents.
-
Click OK.
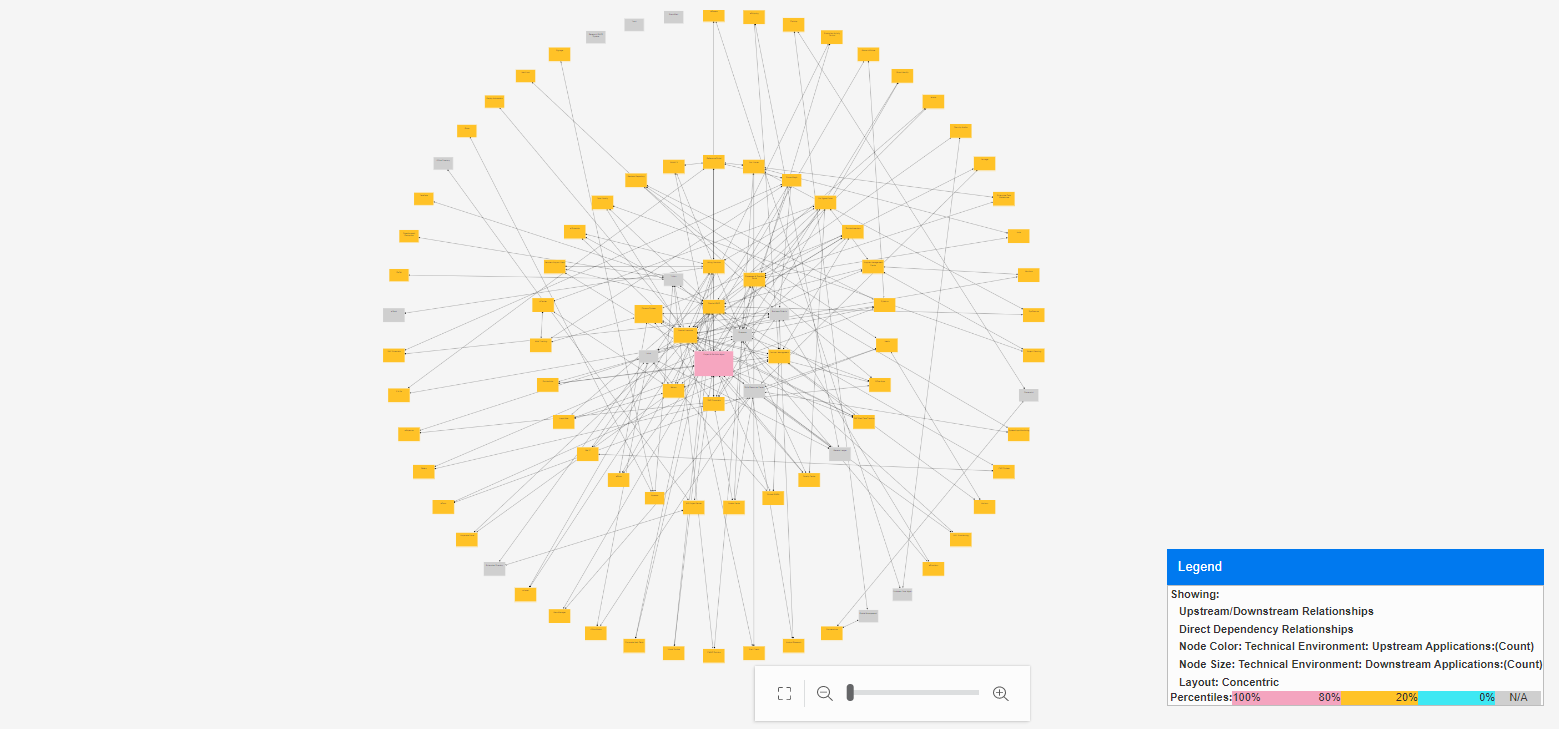
Example
The following example shows an application set that has both the coloring and sizing visual options applied. The node color represents the number of upstream applications and the node size represents the number of downstream applications.
Change application and process display layout
You can change the dynamic graphing layout of applications and processes.
To change the display layout:
-
Start dynamic graphing. For details, see Start dynamic graphing.
-
Select an application or a process.
-
Click Layout Options
 and select one layout from the list.
 -
(Optional) You can also drag an application node and drop it to the target place in the screen.
Save displayed applications as an application set
You can save the displayed applications as an application set.
Considerations
Consider the following when you save the displayed applications as an application set:
-
All applications displayed are considered part of an application set. If you open an application set and view its direct application dependencies, all applications displayed in the graph are considered part of the application set. If you then save your application set, all applications, including the direct dependent applications, are saved to the application set.
-
Using the Save As Application Set option to save an application set as an existing application set does not replace the existing application set. Instead, an application set with the same name is created, but this newly created application set is not active.
Example: Suppose you have two existing application sets, AppSet1 and AppSet2. Open AppSet1 in dynamic graphing, select Save As Application Set, enter AppSet2 as the Name, and then click OK.
When you view a list of your applications sets, you have two application sets named AppSet2. The status of the original application set is Active. The status of the newly created application set is Change Pending. You cannot activate the newly created application set unless you change its name to a unique one (the name is case-sensitive).
Save displayed applications as an application set
To save displayed applications as an application set:
-
Open the target application and click Save
 .
. -
Click Save Application Set.
-
Enter a name and description for the application set and then click OK.
Save a dynamic graph as an image
You can save a dynamic graph as a Portable Network Graphics (.png) file.
Caution: Only the portion of the graph that is visible in your web browser is saved (along with the legend and graph title). You may need to adjust the size of your web browser or minimize the size of the graph in order to save the complete graph.
To save the graph as an image:
-
Open the target application in dynamic graph and click Save
. -
Select Save Image SnapShot.


