Request Browser
You can use the Request Browser to display and track entity information that is hierarchically grouped by specified entity fields. This information includes the total number of entities in each hierarchical entity group. With the Request Browser, you can create hierarchical entity groups of up to five levels deep, and you can break down the totals into a selected set of subtotals. You can also save the hierarchical entity group and selected entity information, allowing you to track the information over a period of time.
When you create an entity group with the Request Browser, you can use dynamic graphing to view the graphical relationships between applications or between processes in the group. (For instructions, see Dynamic graphing.)
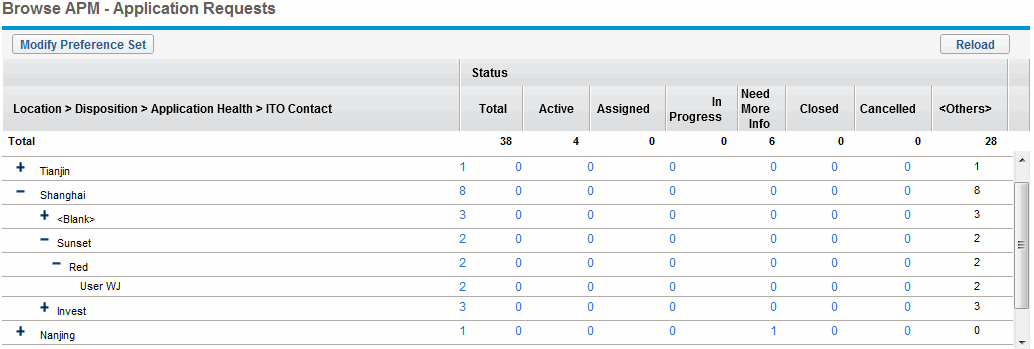
Figure 5-14. Example of hierarchical grouping of applications and application totals and subtotals in the Request Browser shows a hierarchical grouping of applications, broken down by location, disposition, application health, and ITO contact. The total number of applications in each group is broken into subtotals by selected Status values.
Figure 5-14. Example of hierarchical grouping of applications and application totals and subtotals in the Request Browser

For instructions for using the Request Browser to search entities (requests), see the Demand Management User Guide. While you follow the instructions in the Demand Management User Guide, refer to the following example for the options you need to select from the APM menus to get to the Browse Entities and Request Browser pages.


