
Share this page


Bubble chart portlet
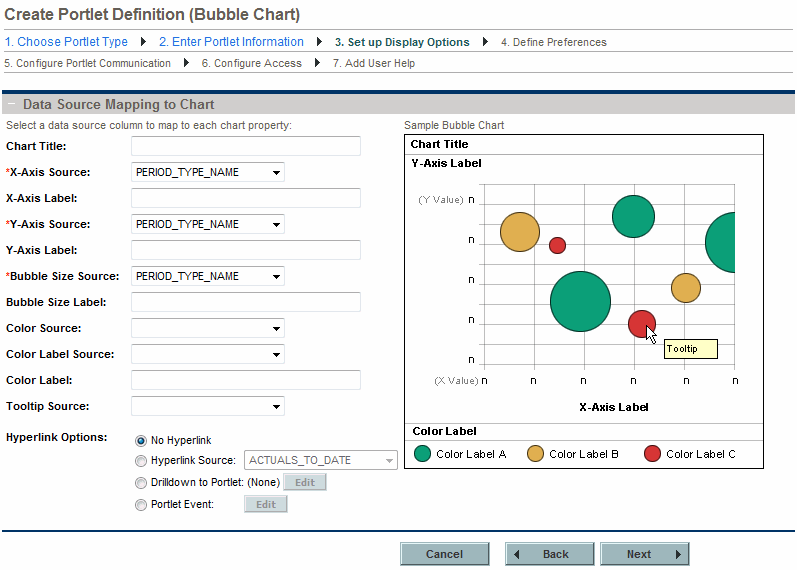
Figure 3-15. Set up Display Options for bubble chart portlets
|
Field Name (*Required) |
Description |
|---|---|
|
Chart Title |
Specify a name for the chart. Type any alphanumeric string (up to 200 characters in length). |
|
*X-Axis Source |
Select the source column for the x-axis. Choices are limited to those columns available in your portlet data source. |
|
X-Axis Label |
Specify a label for the x-axis. Type any alphanumeric string (up to 200 characters in length). |
|
*Y-Axis Source |
Select the numeric source column for the y-axis. Choices are limited to those columns available in your portlet data source. |
|
Y-Axis Label |
Specify a label for the y-axis. Type any alphanumeric string (up to 200 characters in length). |
|
*Bubble Size Source |
Select the source column for the size of the bubble. Choices are limited to those columns available in your portlet data source. |
|
Bubble Size Label |
Specify the label for the bubble size. Type any alphanumeric string (up to 200 characters in length). |
|
Color Source |
Select the source for the color. See Customize portlet colors for details. |
|
Color Label Source |
Select the source for the labels associated with the colors. |
|
Color Label |
Specify the label for the legend. Type any alphanumeric string (up to 200 characters in length). |
|
Tooltip Source |
Select the source column for the tooltip to be displayed when the cursor hovers over an item. Choices are limited to those columns available in your portlet data source. |
|
Hyperlink Options |
Specify whether the column can be linked to another page or portlet, or updates the other portlets on this page. Choices include:
|
Note: You can limit the number of bubbles displayed in the bubble chart by setting the MAX_BUBBLE_CHART_RESULT parameter. By default, up to 500 bubbles are displayed. See the Installation and Administration Guide for more information about setting this parameter.
Setting the Displayed Color Label Length for a Bubble Chart
If the legend of a bubble chart contains many color labels, the labels may be truncated. You can extend the displayed color label length by doing the following:
-
Edit the
<PPM_Home>/server/<PPM_Server_Name>/deploy/dashboard.war/static/app/portlet/css/BubbleChart.cssfile:-
Find the
maxLegendItemLengthkey and increase its value. The value is in pixels. About 1,000 pixels is equal to the 200 character color label length limit. -
Save the file.
-
-
Repeat Step 1 for all nodes in a cluster.
-
Restart the PPM Server.

