Pivot table portlet
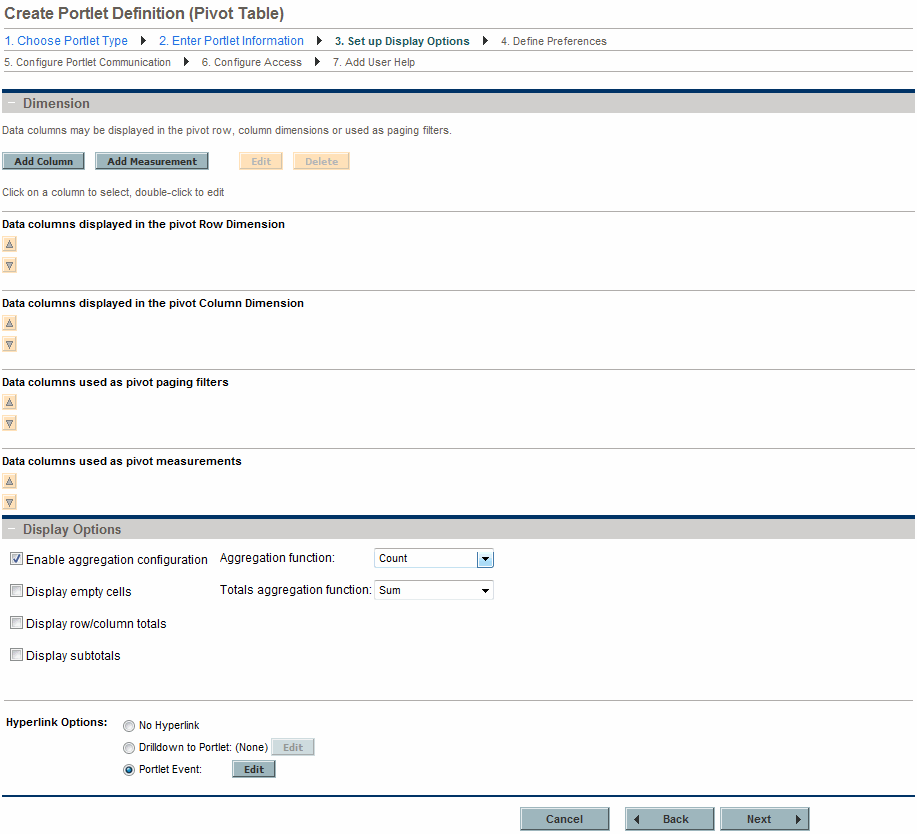
This topic provides details on how to set up display options for pivot table portlet definitions.

|
Field Name (*Required) |
Description |
|---|---|
|
Dimension section |
|
|
Add Column |
Click to add a new data column. See Add a pivot table row, column, or paging filter data column for details. |
|
Add Measurement |
Click to add a new measurement data column. See Add a pivot table measurement data column for details. |
|
Edit |
Select a data column, then click to make changes to that data column. You can also double-click on a specific data column to edit that data column. |
|
Delete |
Select a data column, then click to remove that column. |
|
Data columns displayed in the pivot row dimension |
Use the up- and down-pointers to rearrange the order of the data columns. Double-click on a data column to edit it. This data is displayed one row per category. |
|
Data columns displayed in the pivot column dimension |
Use the up- and down-pointers to rearrange the order of the data columns. Double-click on a data column to edit it. This data is displayed one column per category. |
|
Data columns used as pivot paging filters |
Use the up- and down-pointers to rearrange the order of the data columns. Double-click on a data column to edit it. This data is displayed one table per category. |
|
Data columns used as pivot measurements |
Use the up- and down-pointers to rearrange the order of the data columns. Double-click on a data column to edit it. This is the data that is summarized in the table. |
|
Display Options section |
|
|
Enable aggregation configuration |
By default, aggregation is enabled. Aggregation configuration is the calculation of values based on the selected Totals aggregation function. Disable aggregation if the data source aggregates the data. |
|
Aggregation function |
Select a function to determine how to calculate a value if the data source contains more than one value for a distinct data column. |
|
Display empty cells |
If the data source does not contain any data, the row or column is not displayed. Select this checkbox to display empty cells. The revamped pivot table portlets do not support displaying empty cells, therefore, this field is not available if the revamped version of pivot table portlets is in use (the feature "Use Revamped Pivot Table Portlets" is turned on). |
|
Totals aggregation function |
Select a function to determine how to calculate the totals for the displayed values. The revamped pivot table portlets do not support totals aggregation, therefore, this field is not available if the revamped version of pivot table portlets is in use (the feature "Use Revamped Pivot Table Portlets" is turned on). |
|
Display row/column totals |
Select to display totals for all rows and columns. The value is calculated using the selected Totals aggregation function. |
|
Display subtotals |
Select to display subtotals for each row or column. The value is calculated using the selected Totals aggregation function. The revamped pivot table portlets always show subtotals at group rows, therefore, this field is not available if the revamped version of pivot table portlets is in use (the feature "Use Revamped Pivot Table Portlets" is turned on). |
|
Hyperlink Options |
Specify whether the column can be linked to another page or portlet, or updates the other portlets on this page. Choices include:
|
Add a pivot table row, column, or paging filter data column
To add a new data column (row, column, or paging filter) to a pivot table portlet:
-
Click Add Column.
The Add Pivot Column dialog box opens.

-
Provide the column details using the information from the following table.
-
Add this column to the pivot rows dimension. Data is displayed one row per category. Categories are determined by the values from the data source.
-
Add this column to the pivot columns dimension. Data is displayed one column per category. Categories are determined by the values from the data source.
-
Add this column as a pivot paging filter. Data is displayed one table per category. Categories are determined by the values from the data source.
-
Click Done.
The Add Pivot Column dialog box closes and a new data column is added to the Create Portlet Definition (Pivot Table) page.
|
Field Name (*Required) |
Description |
|---|---|
|
*Column Title |
Specify the column title to display in the portlet. Type any alphanumeric string (up to 200 characters in length). |
|
*Data Source Column |
Select a source column for the information to display in the pivot table column. |
|
Dimension |
Select the dimension of the data. Choices include: |
Add a pivot table measurement data column
To add a new measurement data column to a pivot table portlet:
-
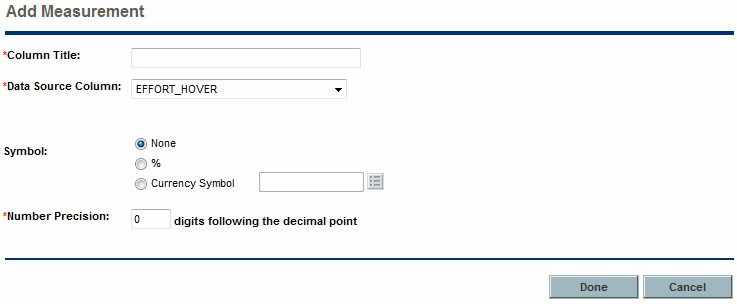
Click Add Measurement.
The Add Measurement dialog box opens.

-
Provide the column details using the information from the following table.
Field Name (*Required)
Description
*Column Title
Specify the column title to display in the portlet. Type any alphanumeric string (up to 200 characters in length).
*Data Source Column
Select a source column for the information to display in the pivot table.
Symbol
Select the symbol to display for the measurement. Choices include:
-
None. Do not display a symbol.
-
%. Display the percentage symbol.
-
Currency Symbol. Select the currency symbol to display.
*Number Precision
Specify the number of decimal places to display.
-
-
Click Done.
The Add Measurement dialog box closes and a new measurement data column is added to the Create Portlet Definition (Pivot Table) page.
Control the size and number of unique values in pivot tables
You can use the parameters listed in the following table to control the size and number of unique values in a pivot table effectively.
|
Parameter |
Description |
Default Value |
|---|---|---|
|
dashboard.Pivotdataset-Max-Rows |
Determines the maximum number of rows in the List display mode of a pivot table portlet. See Figure 3-6. List display mode of a pivot table portlet for more details. |
25,000 |
|
dashboard.Pivotdataset-Max-Cells |
Determines the maximum number of cells (number of rows * number columns) in the List display mode of a pivot table portlet. See Figure 3-6. List display mode of a pivot table portlet for more details. |
120,000 |
|
dashboard.Pivotdataset-Max-Distinct-In-Column |
Determines the maximum number of unique values in any column of a pivot table. See Figure 3-7. Pivot table display mode of a pivot table portlet for more details. |
50 |
|
dashboard.Pivotdataset-Max-Distinct-Cells |
Determines the maximum number of unique aggregations (product of numbers of unique values in each column) in a pivot table. See Figure 3-7. Pivot table display mode of a pivot table portlet for more details. |
10,000 |
- Note:
- The maximum number of rows in a pivot table is also affected by the
PORTLET_MAX_ROWS_RETURNEDparameter, which determines the maximum number of rows to display in a portlet. The default value for this parameter is 200, meaning that if you have more than 200 rows to display in a pivot table portlet, you must increase the value of thePORTLET_MAX_ROWS_RETURNEDparameter accordingly. - Since PPM 9.62, if the revamped pivot table portlet is in use (the feature "Use Revamped Pivot Table Portlets" is turned on), you can choose to ignore the dataset limits determined by the parameters listed in the table above by turning on the feature "Ignore Pivot Dataset Limits".
Caution:
-
Performance issues may occur if the value you set for any parameter exceeds the corresponding default value.
-
Performance varies with hardware, software, and system configurations in your environment. If performance degrades when system load reaches the default values, we recommend that you lower the values of the parameters.
-
If a pivot table has a very large volume of data, we recommend that you NOT switch between columns and rows in the table.
Figure 3-6. List display mode of a pivot table portlet

In Figure 3-6. List display mode of a pivot table portlet, the number of rows in the List display mode of the pivot table portlet is five. If the value of Pivotdataset-Max-Rows is lower than five, you receive an error message, advising you to limit the number of rows.
In Figure 3-6. List display mode of a pivot table portlet, the number of cells in the List display mode of a pivot table portlet is 15 (5 * 3). If the value of Pivotdataset-Max-Cells is lower than 15, you receive an error message advising you to limit the number of cells.
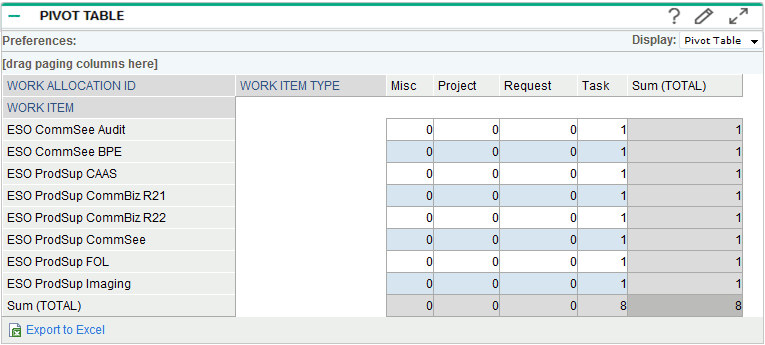
Figure 3-7. Pivot table display mode of a pivot table portlet

In this pivot table, column WORK ITEM has eight unique values, which is the largest number of unique values among all columns. If the value of Pivotdataset-Max-Distinct-In-Column is lower than eight, you receive an error message, advising you to limit the number of unique values in this column.
In this pivot table, column WORK ITEM has eight unique values, and column WORK ITEM TYPE has four unique values. Therefore, the number of unique aggregations is 32 (8 * 4). If the value of Pivotdataset-Max-Distinct-Cells is lower than 32, you receive an error message, advising you to limit the number of aggregations in this table.
Note that if a pivot table is larger than 2 MB, the table cannot be exported to Excel. This is caused by a default setting in Apache Tomcat. In Apache Tomcat, the maxPostSize attribute determines the maximum size in bytes of the POST, which is to be handled by the container FORM URL parameter parsing. If not specified, this attribute is set to 2097152 (2 MB), which limits the size of the pivot table.
To work around this limitation, edit the Tomcat's server.xml file to add the maxPostSize attribute to the Connector element, and then set the attribute to a larger value in bytes. Alternatively, set the attribute to 0, which disables the size check.


