
Share this page


Capacity planning
The budget
In this topic:
Analyze capacity utilization
What-if analysis provides constraint indicators such as Budget Remaining and Resource Remaining to analyze resource and budget utilization.
Tip: To analyze the budget
To analyze the capacity utilization:
-
Open a scenario's details page.
-
At the top-right of the page, select Strategic Planning Gantt View.
-
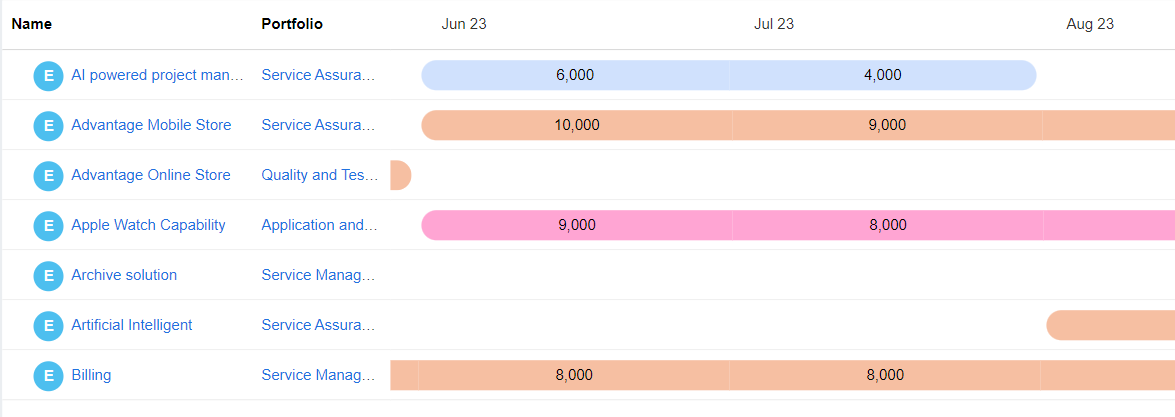
The Budget Remaining and Resource Remaining tables display how much budget and resources remain after being allocated to the moved-in contents in the scenario.
-
To see the capacity and demand, click the down-arrow next to Budget Remaining.
Calculate remaining, capacity, and demand
The following table describes how capacity, demand, and remaining of each time period is calculated.
| Constraint | Details |
|---|---|
| Budget |
|
| Resources |
|
The resource capacity is manually entered in the Resource Constraint table.
To enter the resource capacity:
- Next to Resource Remaining, click the down arrow to expand the Capacity row.
- In each cell corresponding to the time period, enter the capacity value for that specific period.

Reschedule contents
When you find budget
To shift the content start date:
Tip: To shift the content start date, the layout template must contain the Board View or Hierarchy Gantt View component type. You can use the predefined
-
Open a scenario's details page.
-
At the top-right of the page, select a layout template that contains the Board View or Hierarchy Gantt View component type. For details, see Switch scenario layout templates.

Contents whose time periods fall within the scenario time period are represented as a Gantt chart. The Gantt chart can be customized to display
Curved lines on the left of the Gantt indicate that contents start earlier than the scenario start period; while curved lines on the left of the Gantt indicate that contents finish later than the scenario end period.
-
To start work earlier, drag the Gantt of a content leftward. To postpone work, drag the Gantt rightward. The original time period is presented in a lighter shade.
If a program has contents, shifting the program's start date would shift the start date of all its contents accordingly. Shifting all its content's starting date would shift the program's start date accordingly.
-
-
Click Save to save the changes made to the scenario.
-
If you want to discard time period changes made to the scenario, click Restore.
Apply time period changes to portfolio
If shifting content start date reduces the capacity-demand gap, you can apply these changes to the portfolio.
To apply time period changes to portfolio:
-
Open a scenario's details page.
-
At the top-right of the page, click Apply.
-
The Time Period Changes section in the Apply preview for scenario page displays the proposed time period changes.
-
Review the proposed modifications and select the portfolio contents where you want to implement the new time periods.
-
Click Apply at the top-right of the page.
Note: When the Gantt is configured to display forecast resources, after dragging the Gantt to change the time periods and applying the changes, the Gantt does not immediately reflects the updated resource data. You need to wait for the background service to run to se the updated resource data.
 See also:

