Share this page


Anomalies
This section describes anomaly detection, which enables you to quickly, intuitively, and effectively identify abnormal application behavior in load tests.
Anomaly detection overview
Anomaly detection insights speed your investigation into system performance, and help determine the root cause of detected deviations. You can view anomalies in real time while a load test is running, or after a test run has finished.
LoadRunner Cloud uses an algorithm to determine when an anomaly has occurred.
The algorithm is split into two main parts:
-
Detecting if a point in a series is abnormal, relative to other points. For details, see Detecting an anomaly.
-
Notifying the user when a measurement behaves abnormally within a certain time range. For details, see Notification of an anomaly.

Detecting an anomaly
LoadRunner Cloud uses a statistical assumption that the series of data points approximately follows a normal distribution, and deviates in a standard manner over time.
For every measurement, it continuously calculates the mean and standard deviation. Then, for each point, weighted versions of the mean and standard deviation (which give higher priority to more recent points) are calculated. These weighted results are used to create the range. The range is then 6 “weighted standard deviations” around the “weighted mean” of the measurement.
Every point in the series that is above, or below the normal range, is considered abnormal. LoadRunner Cloud assigns a ranking to each anomaly based on the earliest occurrence, size, and duration of the deviation. The rank represents how the anomaly compares to other anomalies seen for the metric in the same run. The more severe or unusual the anomaly, the higher the rank. The rank range is between 0-5.
When LoadRunner Cloud detects that a measurement has behaved abnormally, it displays the sum of the metric’s anomaly ranks in the metrics pane together with the number of anomalies in parenthesis. For details, see Metrics pane columns.
Notification of an anomaly
LoadRunner Cloud notifies the user when a measurement behaves abnormally within a certain time period.
Not all deviations are considered anomalies; only when a measurement deviates from the normal range for a significant period of time.
LoadRunner Cloud determines this by keeping a baseline of the last 30 points for each measurement. Each point that deviates from the range is given a value of 1, and 0 if it is inside the range. For example, a measurement with a baseline sum of 0 means that all points are in the range, whereas a baseline sum close to 30 means that most points are deviating.
LoadRunner Cloud notifies the user of an anomaly when the baseline sum for a measurement is above 18. This means that 60% of the points in the baseline are above, or below, the normal range.
Note: LoadRunner Cloud gives more weight to measurements with a baseline that has consecutive deviations (0000011111) than to an unstable baseline (0101010101). This is because measurements that spike are not deviating in a standard way, and are more likely to result in false-positive notifications.
Understanding the graph
Each dot in the graph represents the values of the selected metric over time.
Anomalies are shown as an orange line. When you click an anomaly, the graph displays an orange shaded area. The intensity of the orange color is determined by the rank of the anomaly—the higher the rank, the stronger the color.
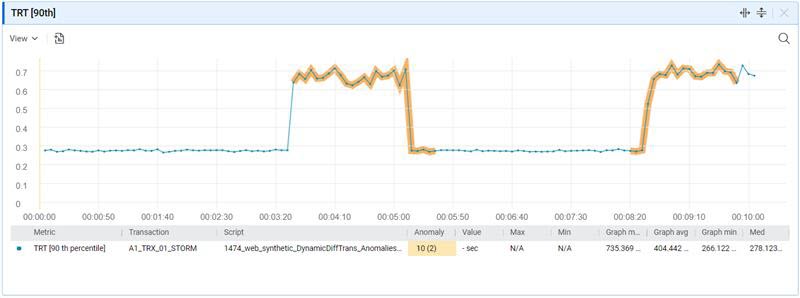
Placing the cursor on any part of the line and clicking in the graph generates a tooltip with information that is related to the anomaly at that particular point in time.
 See also: