Performance Model Editor
The Performance Model Editor enables you to configure performance metrics for a virtual service to use during simulation. You can configure the performance for the whole service or for its individual operations.
| To access |
Use one of the following:
|
| Important information |
|
| Relevant tasks | |
| See also |
User interface elements are described below (unlabeled elements are shown in angle brackets).
Common Areas
| UI Element | Description |
|---|---|
| <performance model name and description> | The name and description of the data model. Click to edit. |
| <operations> |
Located in the left pane of the editor. Displays a list of the operations in the service associated with the selected performance model. By default, the service name is selected, and a performance overview is displayed in the main pane of the Performance Model Editor. For details, see Service Level View. Enter text in the filter box to filter for specific operations in the list. Select an operation from the list to display its details in the main pane of the Performance Model Editor. For details, see Operation Level View. |
| Edit Service Description | Opens the Service Description Editor. For details, see Service Description Editor. |
Service Level View
| UI Element | Description |
|---|---|
| Booster |
A set of boosters to provide high-level control of the operations selected in the operation table. Available boosters include:
Note: You must restart the simulation to apply changes. |
| <booster controls> | The sliding controls and inputs enable you to set the boost level for the selected booster. The setting affects the various performance criteria displayed in the operation table. |
| Performance Metrics |
Enables you to set more granular settings for individual performance criteria for individual operations. You can set the following:
To apply the performance changes to the service and all of its operations, select the Boost, Throughput Limit, or Transaction Limit checkboxes at the top of the table. Alternatively, select options separately for the service and per operation. Click an operation name to open the operation level view for the specific operation. Note: Throughput Limit and Transaction Limit are not affected by learned data. Learning does not modify these values. |
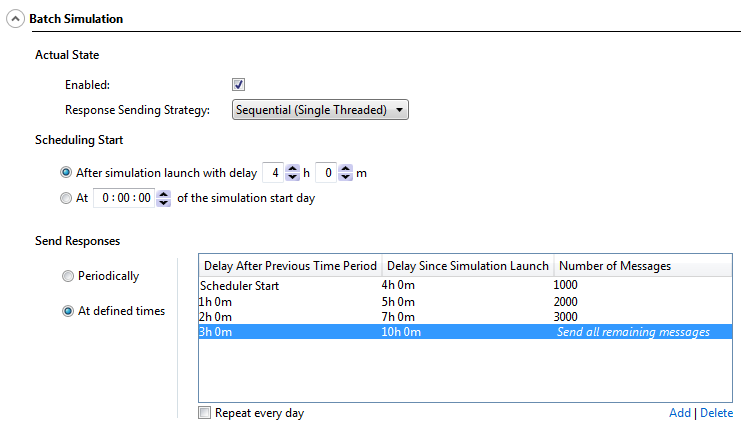
| Batch Simulation |
Enables you to define a schedule for sending responses back to the client application. Click an operation name to open the operation level view for the specific operation. For details, see Batch Simulation. |
Operation Level View
Performance Metrics
| UI Element | Description |
|---|---|
| <performance graph> |
The graph displays the expected performance based on the criteria set for the operation. In Range mode (see below), the expected performance is displayed between the minimum and maximum values that you specified for the range. Select Show Measured Data to view any recorded performance data in the graph. Note: This option is displayed only after data is recorded for the service. The graph is interactive. Move the graph elements to show the effects on performance. |
| <performance criteria> |
Displays the advanced performance criteria for the operation with the option to edit them. The following additional criteria are available:
The following metrics are only available for the Fixed with tolerance mode:
Click a metric to edit its value. |
| UI Element | Description |
|---|---|
| Actual State |
Enable batch simulation. Select a response sending strategy:
|
| Scheduling Start |
Defines when the virtual service will start publishing message responses.
|
| Send Responses |
Defines when or how often response messages are sent. Note: Responses are created immediately after the request is received by the virtual service. This is important, for example, when the virtual service includes service call activity, or date/time generator functions. Options include:
|
|
Example: The schedule is set to start 4 hours after simulation starts.
|


