Share this page


Use run results
Relevant for: GUI tests and components, API testing, and business process tests and flows
After you run a test or component, UFT One displays results that detail the success or failure of each step, and the reasons behind each failure (if necessary). These run results are opened automatically as a separate tab in the document pane immediately after the test or component run.
Viewing and sharing HTML run results
The run results are saved on a single HTML page, with links to other resources, such as the data table used with a test run, screen captures of the application being tested, and movies of the test run.
Because the run results are saved in HTML format, they can be exported and/or sent to other people without the need to have UFT One installed.
If you send the run results to another user, make sure you send entire run results folder. This ensures that all links to resources continue to work for the other user.
UFT One run results are supported in the following browser versions:
-
Internet Explorer 10 or higher (with Compatibility Mode disabled)
-
The latest supported version of Chrome.

View your test flow results
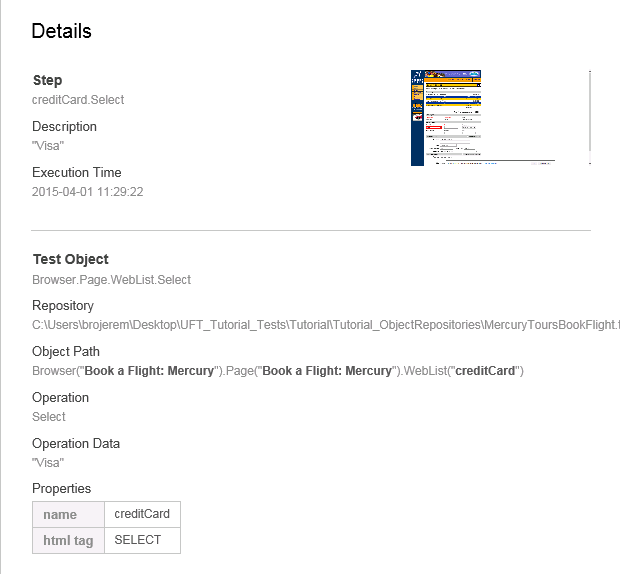
The run results show a description of each step in your test, even if the test or action ran over multiple iterations.
Details about application objects and test objects used in the step are included, as well as the properties used to identify the test object. Overall statistics about the steps passed, failed, and with warnings is shown at the top-right.
For example:
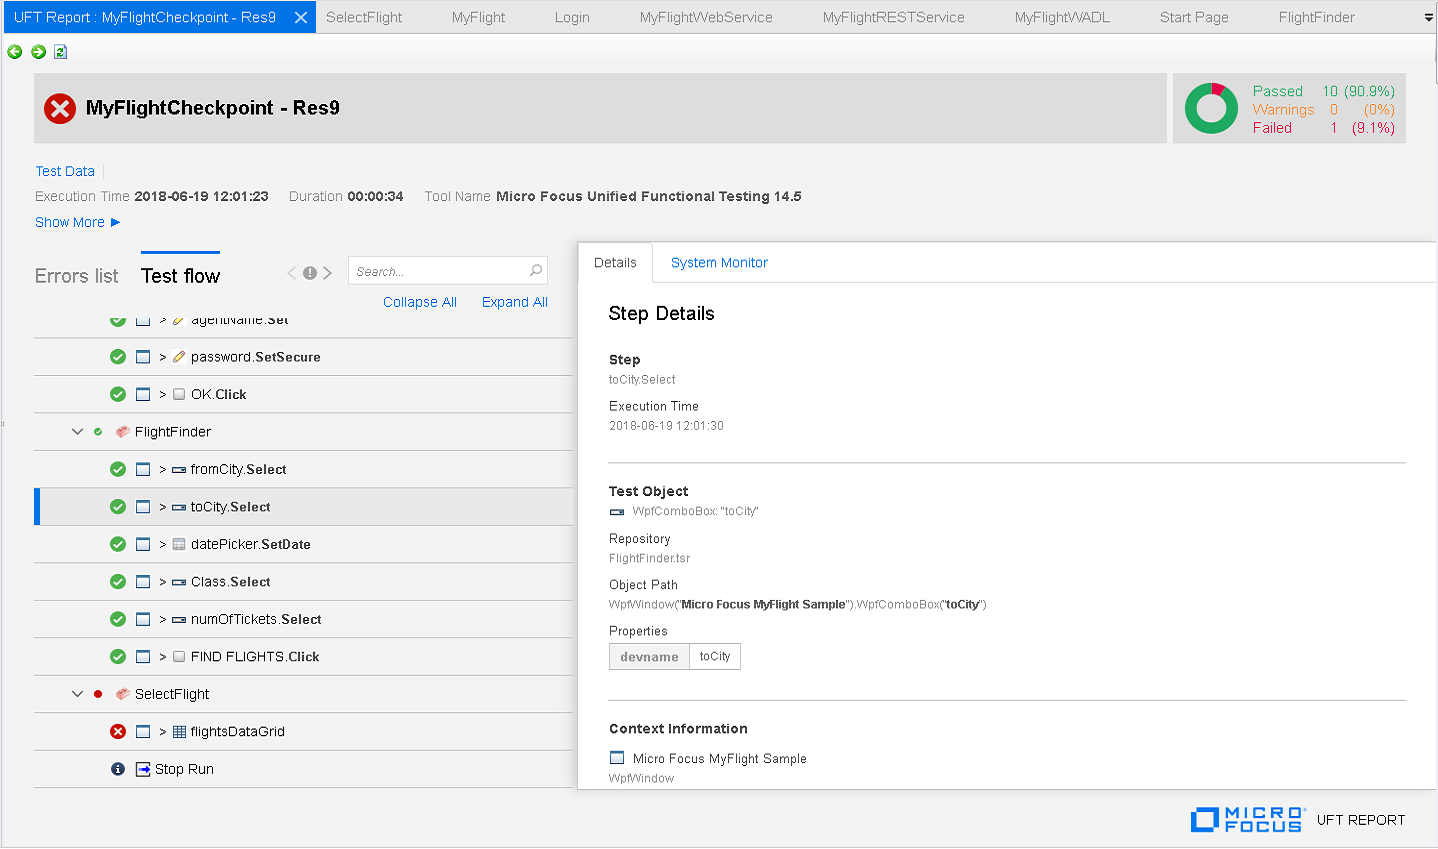
Use the search bar to filter the items shown.
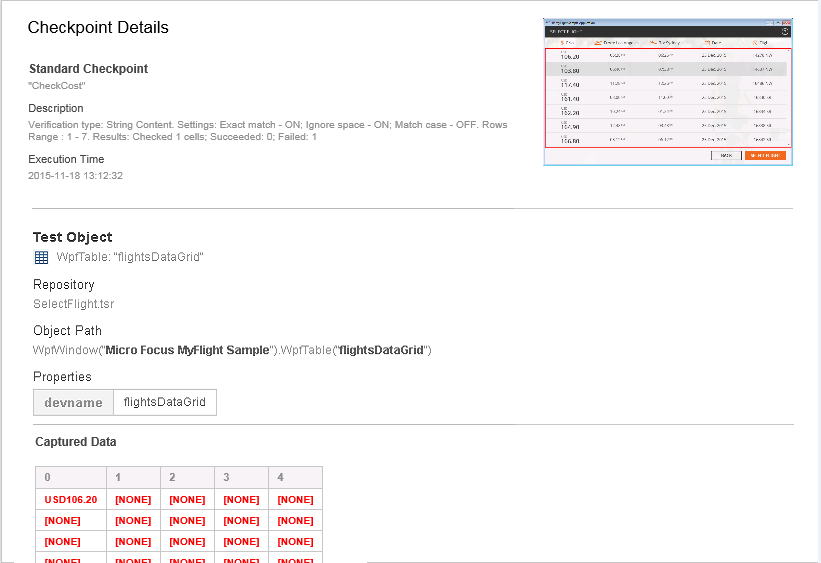
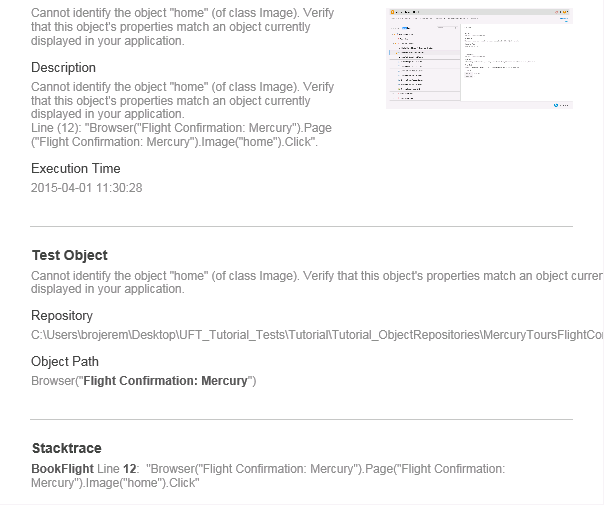
View error and warning information
View specific details about the errors and warnings that occurred in your test flow, including the test object used and the expected result.
For checkpoints, the checkpoint details are also displayed.
For example:
Smart Identification descriptions
If Smart Identification was configured for your test objects before the test run, and was successfully used to identify and locate an object in your application, the run results show a warning, as well as a table of the object properties attempted and used.
For example:
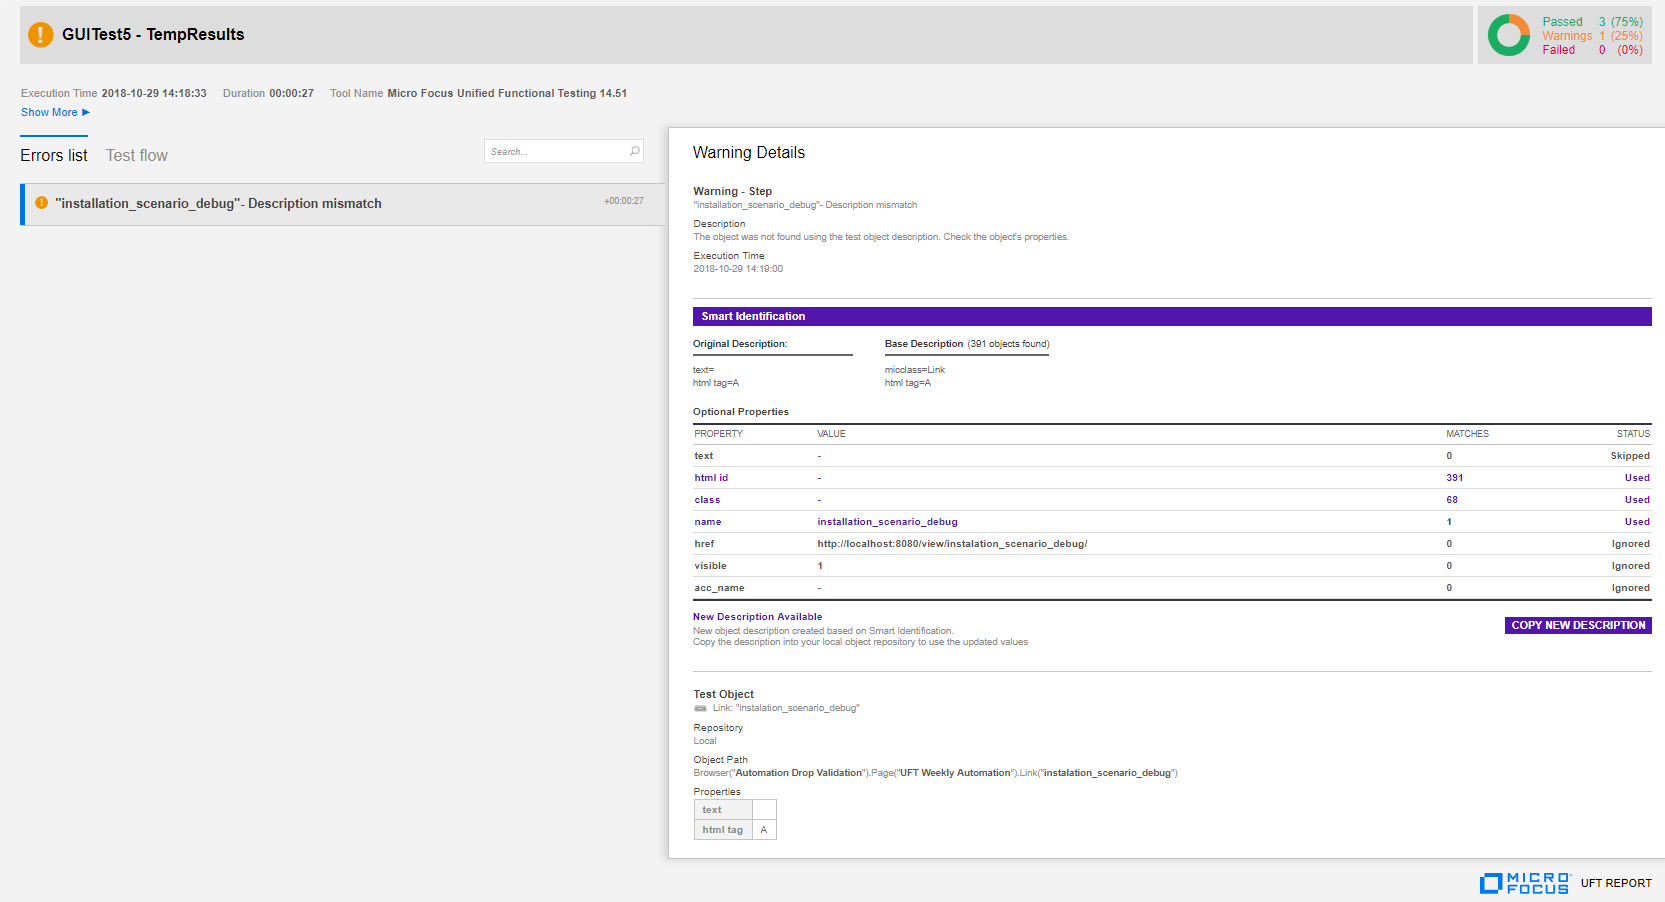
Tip: UFT One also generates a new object description for you, based on the Smart Identification properties used.
Click COPY NEW DESCRIPTION below the Object Properties table to copy the new description to your clipboard. From there, you can copy updated values into the object description in your repository.
For more details, see Update test object description from the clipboard.
View local system monitoring data
View local system monitoring data captured during your test run, as defined in the UFT One test settings.
If Local System monitoring is configured for your test or application area:
- Click the System Monitor tab in your run results to show a graph of your data throughout the test run.
- Click a step in the Test Flow to view a vertical red line, indicating the data in the chart specific to the selected step.
- Click items in the legend at the bottom to modify the data displayed.
- At the top right of the graph, click Data File to view the captured data in a text file.
For example:
For more details, see Local System Monitor Pane (Test/Business Component Settings Dialog Box / Application Area - Additional Settings Pane).
Graph normalization
UFT One normalizes the data on your graph in order to display it properly. If your test has more data points than fit on the Y axis of the graph, UFT One multiplies the real value of each point with a specific scale, as needed. The legend at the bottom of the graph indicates the adjustment applied on each counter.
Example: In the image above, the true Handle Count value is around 600, as shown in the hover tooltip.
This is out of range for the graph, which only rises to 100. Therefore, UFT One multiplies this value by 0.1, and then draws the values on the graph at around 60.
View screen captures from your application
As part of the test step result details, you can see a screen capture of your application during the run session, either for every step or for steps with errors. For steps or errors on specific objects in the application, UFT One highlights the application object in the screen capture:
For mobile objects, UFT One can include a short animated .GIF recording of each step instead of a still image. (Requires UFT Mobile 3.4 or later)
Click the screen capture to zoom. Click the border or press ESC to close the image.
Select the type and level of screen capture detail in the Screen Capture pane of the Options dialog box (Tools > Options > GUI Testing tab > Screen Capture node).
Known issue: If you are using the accelerated mechanism when running web tests (see Web > General Pane (Options Dialog Box)), objects located further down the web page may be highlighted incorrectly in the screen captures.
View call stack details for errors
When you encounter an error in your test, you may need to perform some investigation to find where the error occurs. To help with this, the run results display a call stack log for any errors encountered during the test run:
View data resources and movies
The run results include links to any test resources saved, including a data table used with your test, or a movie captured of your run session.
For example, to open your data table, click Test Data at the top left:
If you send run results with a data table to another user, make sure that you send the entire run results folder. This ensures that the Test Data link in the run results can find the data table file.
View custom report messages
When you run steps in a GUI test using the Reporter object, these messages are displayed in the run results, in the step in which they are run. For details on the Reporter object, see the Utility Objects section of the UFT One Object Model Reference for GUI Testing.
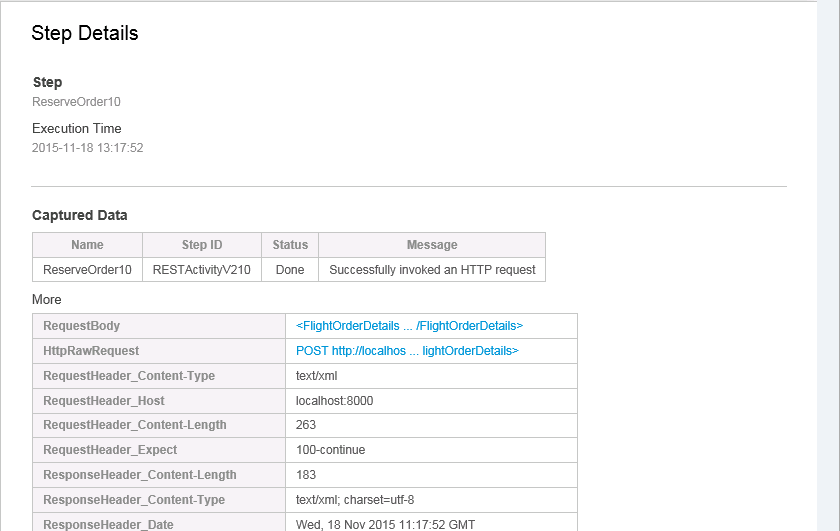
View captured data for test steps
For each API test step, the run results report the property values used to run each step. These values are reported in a grid which shows the input and output values.
This grid also includes any custom messages send to the run results with event handler code.
For each API test step in the test flow, the run results provide the captured values as part of the test step summary:
View run results from ParallelRunner
Running tests in parallel using the ParallelRunner command line tool generates a consolidated report with results from all tests run.
For details, see Sample ParallelRunner response and run results.
View full details of your business process test
When you run a business process test in UFT One, UFT One can display all the details of the entire structure of your test, including:
-
Business process flows
-
Component groups
-
Run conditions
-
Component requests
-
Steps with all types of components, including scripted GUI components, keyword GUI components, and API components
Within each type of component, the individual steps are displayed in the same way as for a GUI test or API test, with each test step displayed separately and details in the Details pane.
View run results in the Run Results Viewer
UFT One continues to support the Run Results Viewer application. For details, see
The Run Results Viewer application is also relevant when working with ALM:
| ALM versions earlier than 12.50 |
If you save UFT One run results in an ALM version earlier than 12.50, results are displayed in the Run Results Viewer format only. This is true even if the HTML report is set in the Run Sessions pane of the Options dialog. (Tools > Options > General tab > Run Sessions node). |
| Business components | If you are running a business component, the HTML report option is supported only from ALM versions 12.53 and higher. |
View suggestions to transform steps into AI-based steps
If you run your tests with the AI Transformation Assistant enabled, the test results contain AI object suggestions instead of the results of your test run.
Each step contains a suggestion for transforming the technology-based test step into an AI-based testing step. Replace existing steps with the suggested AI object steps to create a more resilient and platform-agnostic test.
To enable the assistant in Tools > Options > GUI Testing > AI, select Replace run results with AI object suggestions.
View automatic scrolling details
If you run your AI-based tests with the automatic scrolling enabled, in the test report, for steps during which the automatic scrolling is performed, UFT One displays the details about the number of scrolls performed to search for an object and the direction of the scrolls.