Identify hotspots in your code
Commit information is used to help you, the developer, identify hotspots in the code. After it has been identified, you can minimize risks associated with updating the code.
Use hotspots to minimize risks
Hotspots are files that contain sensitive code, which is risky to change. The code might be too complex, or the functionality it covers might be insufficiently tested.
To reduce the risk of future changes causing quality issues:
-
Simplify and refactor the code.
-
Increase testing of this code's functionality.
Hotspot criteria
Commit information is used to identify hotspots. A file is considered a hotspot if it was recently changed when fixing a defect.
The hotspot level is the level of potential risk when changing code in a hotspot. A high hotspot level indicates that changing this code has a high risk of introducing regressions or other quality issues.
The hotspot level is determined based on the following criteria:
- The number of defects associated with this file.
- The age of the changes made to this file.
This means the level is time-sensitive. Over time, if no additional defect-related changes are committed on a hotspot file, its hotspot level diminishes.
Set up the hotspot dashboard widget
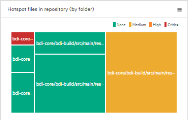
The hotspot widget in the Dashboard displays a heatmap of your code base folders, highlighting areas by hotspot level.
Prerequisites
- Make sure a pipeline was created on a CI server that works with an SCM system. For details, see Create and configure pipelines.
- Make sure to associate your commits with the relevant backlog items using commit messages. For details, see Customize SCM change patterns.
To configure the widget:
-
In the Dashboard module, locate the Hotspots files in repository (by folder) widget.
If it is not displayed, click the Add Widget button
 and add the widget to your dashboard.
 -
Configure the widget to show the code base you want to assess:
In the Data tab, select a Repository and a Base folder for risk assessment.
The lists to select from include the repositories and folders available through the CI server SCM integration.
Assess potential risk using the hotspot widget
After you Set up the hotspot dashboard widget, the widget displays a heatmap of your code base folders, highlighting areas by hotspot level. The hotspot level of a folder is the average hotspot level of the files in that folder.
To assess potential risk using the widget:
-
Check which folders contain a higher percentage of hotspots.
-
Each area in the heatmap represents a folder under the base folder, regardless of folder structure.
-
The size of each area indicates the amount of files in the folder.
Note: Files are analyzed only if they were changed in SCM commits discovered as part of a pipeline run.
Over time, this will cover more and more of your code base.
-
The color of each area indicates the hotspot level. This is the level of potential risk in changing a hotspot file.
-
-
Hover over an area in the heatmap to see a breakdown of the hotspot levels within a specific folder. You can see the number of files in the folder for each level.
-
Click an area in the heatmap to see the hotspot levels of each file in the folder.
Identify risky commits and features at risk
A risk indication ![]() is displayed for commits that include changes to hotspot files and for features associated with such commits.
is displayed for commits that include changes to hotspot files and for features associated with such commits.
- Identifying risky commits can help isolate the problem when analyzing pipeline failures.
- Identifying features at risk can help assess feature release readiness.
Examples for using the risk indication
-
In the Pipelines module, open a failed pipeline run's Analysis > Test Runs tab.
-
Select the failed test run and open the Commits tab.
-
If a related commit is marked as risky
 , check whether it is the cause of the failure.
- In the Team Backlog module, open the Commits tab.
- Add the Risk column to the grid if it's not there.
- If many commits are marked as risky, this means that hotspot files are being changed. You may want to discuss additional testing or code refactoring with your team.
-
In the Backlog module, open the Features tab.
If a feature is associated with risky commits, the risk indication
 is displayed on the feature in the Smart List view. You can see how many of the commits for this feature were risky.
 In the grid view, use the Risky Commit Count column.
-
In the Dashboard, use the Features by risky commits dashboard widget.
Note:
- Unknown. Commits not associated with any backlog item via commit message.
- Backlog. Commits associated with backlog items that do not belong to a specific feature.
Identify application modules at risk
Include the percentage of risky commits in the criteria used by the Quality by application module dashboard widget. Application modules in this heatmap are marked Needs attention if they are associated with more risky commits than the threshold you define in the Criteria tab.
 See also:


