Share this page


This pane provides summarized replay results and links to script replay details.
| To access |
Use one of the following:
|
| Important information |
To enable transaction breakdown data, select Tools > Options > Scripting > Replay > Collect replay statistics. Note: Enabling the Collect replay statistics option will affect replay performance. |
| See Also |
User interface elements are described below (unlabeled elements are shown in angle brackets).
The actual information included in the Replay Summary report varies, depending on the protocol.
| UI Element | Description |
|---|---|
|
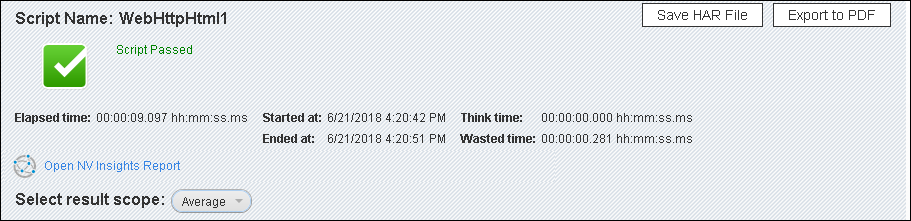
Results Dashboard
|
Displays basic script information including:
|
|
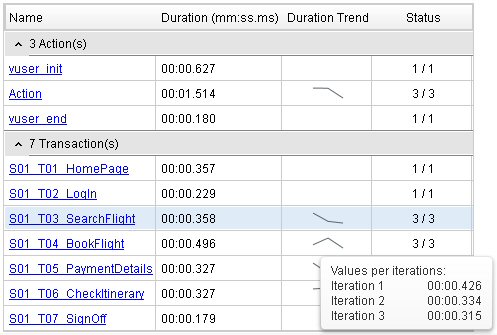
<Script Performance>
|
A list of the script's actions and transactions with basic information. Click on an action or transaction to show or hide its details below the table (only available if you enable the collection of replay statistics) .
|
|
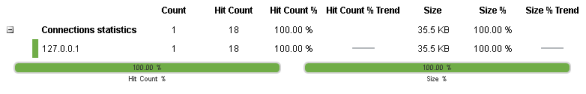
Connection statistics Details
|
A collection of statistics per action or transaction, as per the selected scope (the script average, a specific action, or a specific iteration). Note: These statistics are available for Web - HTTP/HTML and SAP - Web protocol scripts only.
|
|
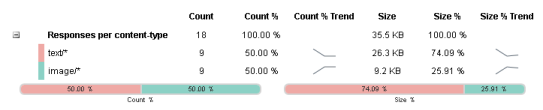
Responses per content-type Details
|
Content-type statistics per transaction or action for the current scope (the script average, a specific action, or a specific iteration). Note: These statistics are available for Web - HTTP/HTML and SAP - Web protocol scripts only.
|
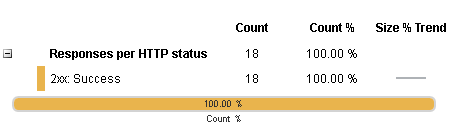
| Responses per HTTP status Details
|
HTTP Status statistics per action or transaction for the current scope (the script average, a specific action, or a specific iteration). Note: These statistics are available for Web - HTTP/HTML and SAP - Web protocol scripts only.
|
|
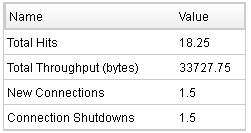
Replay Statistics Summary
|
A list of script statistics and their values after replay, per scope (the script average, a specific action, or a specific iteration). |
|
<Replay Button> 
|
Enables you to replay your script from the Replay Summary pane. |
|
<Modify Runtime Settings> 
|
Enables you to access Runtime Settings for your active script. |
|
<Modify Content Check Rules> 
|
VuGen's ContentCheck mechanism enables you to detect all types of errors sent by the web server. For details, see Internet Protocol > ContentCheck view in the runtime settings. |