Share this page


Recording Report
VuGen's Recording Report provides general information about your recording session, as well as detailed information about hosts, headers, and content types. The report also enables you to manage traffic filtering.
Note:
- This feature is available for Web HTTP/HTML, SAP - Web, and DevWeb scripts only.
- DevWeb scripts: Design Studio, and some of the Recording Report functionality, are not supported for DevWeb scripts.
Enable/disable the Recording Report
By default, VuGen automatically generates and displays the Recording Report in the Script Editor pane at the end of a recording session. A link to the report is also added to the script tree:
You can change the default setting in Tools > Options > Scripting > Recording > Generate Recording report.
If you disable the option to Display the Recording report when recording is finished, VuGen automatically opens the correlation Design Studio instead.

Recording Report overview
The Recording Report displays the Dashboard, containing top-level details about your recording session.
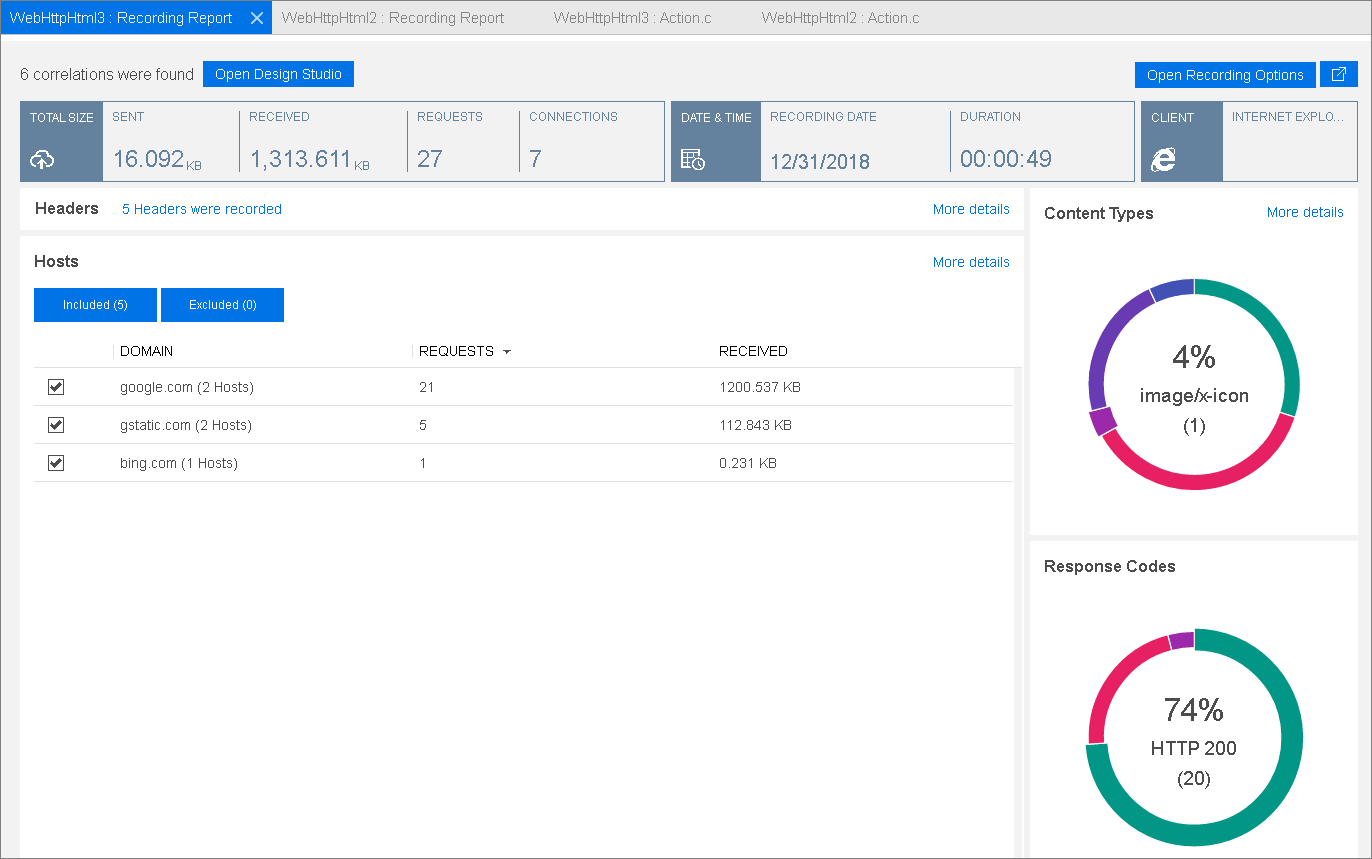
The Dashboard displays the following:
| UI Element | Description |
|---|---|
|
General recording information |
The top of the Dashboard provides general information on your recording session:
|
| Headers |
The number of headers observed during the recording session. Click More details to drill down to the Headers Recorded in Session page. |
| Hosts |
Displays information on the number of host requests per domain, and the total size of data received from the domain during the recording session. Use the check boxes to remove domains from the script. The Included and Excluded buttons enable you to control what is displayed in the list. Click More details to drill down to the Hosts Recorded in Session page, where you can view more detailed information for each domain, and remove specific hosts from the script. |
| Content Types |
Click on a colored segment of the circle to view distribution information for each recorded content type, for example, image/jpeg. The center of the circle displays the count of appearances for that content type during the recording session, and the percentage of the total amount. Click More details to drill down to the Content Types Recorded in Session page. |
| Response Codes |
Click on a colored segment of the circle to view distribution information for each response code, for example, HTTP 200. The center of the circle displays the count of appearances for that response code during the recording session, and the percentage of the total amount. |
Tip: Use the button in the upper-right corner of the Recording Report to expand to full window size.
Drilldowns and traffic filtering for script content
When you record your application, unwanted information is often included in the script, such as Google statistics, advertisements, and third party information. You can drill down from the Recording Report to the following pages and filter the recording, so that you can include or exclude parts from your generated script.
Note: To manually edit the filter lists in Recording Options, click the Open Recording Options button at the top of the report.
Regenerate the script
When you make a change in the report, a red asterisk is displayed next to the changed entity, and the Regenerate button appears at the bottom of the screen. Click to regenerate the script.

The changes are applied to the script, and the relevant filters are updated in Recording Options.
Note: Manual enhancements to a recorded action step are lost when regenerating the script. For more details, see Regenerate a Vuser script.
 See also: