This section explains how to log onto Performance Center, and use it for running your day-to-day performance testing activities.
Log onto Performance Center
-
Open your web browser and type the Performance Center server URL in the following format:
http://<PCS server name>/loadtestThe Performance Center Login window opens.
Note:
-
If more than one Performance Center server is installed in your system together with a load balancer, you should access Performance Center by entering the load balancer's URL. Alternatively, you can also enter the server's defined internal URL.
-
Contact your system administrator if you do not have the correct URL.
-
-
Enter the user name and password assigned to you by your site administrator.
-
Select Automatically log in to my last domain and project on this machine or click the Authenticate button.
-
If you specified automatic login, click the Authenticate button. Performance Center opens to the last project in which you were working.
-
If you clicked the Authenticate button, select a domain and project (Performance Center lists the domains and projects depending on your access rights). By default, the last project in which you were working is displayed.
Click the Login button. Performance Center opens. If unable to log in to Performance Center, see Troubleshooting login issues.
Note: The system administrator can control user access to Performance Center projects by defining user groups that can enter them, and by determining the types of tasks each user group performs according to permission levels. For details, see Managing User Groups and Permissions in the ALM Lab Management Guide.
-

Change project without logging out
-
From the Performance Center navigation toolbar, click the <Domain>\<Project> drop-down arrow.
-
Select a domain and project (Performance Center lists the domains and projects depending on your access rights), and click OK.
Performance Center user interface
This section describes the menus and buttons in the Performance Center masthead.
|
UI Elements |
Description |
|---|---|

|
Module Navigation Toolbar. Click to display the navigation toolbar, enabling you to navigate to a selected module. Includes the following modules: Dashboard, Testing, Assets, Resources, Applications, and Reports. |

|
Contains a link to the Performance Center Help and About screen. |

|
Enables opening and closing any open test tabs directly from the navigation area. This is available after drilling down from the Dashboard, online or offline screen, results page, event log, and reports.
Click the panel to display the list of open tests, and then click a Run ID link to open the selected test in the Test Run page page, or a Test ID link to display a test in the Performance Test Designer window.
You can switch between collapsed mode
|
|
|
<Domain>\<Project>. Displays the selected domain name and project name. Click the drop-down arrow to change domain and project (Performance Center lists the domains and projects depending on your access rights). |

|
Displays the current user name. Click the drop-down arrow to log out of your current project and return to the Performance Center Login window. |
| Modules | |
|
|
Dashboard. Displays the Performance Center Dashboard. For details, see Dashboard. |
|
|
Usage Reports. Enables you to generate usage reports to help monitor and manage usage of Performance Center resources. You can also generate reports from Performance Center Administration ( |
|
|
Testing
|
|
|
Assets
|
|
|
Resources
|
|
|
Applications
|
| Create New Test | Opens the Create New Performance Test dialog box, enabling you to create a new test. For details, see Create a test. |
 Indicates the number of running tests.
  Indicates the number of tests open for editing.
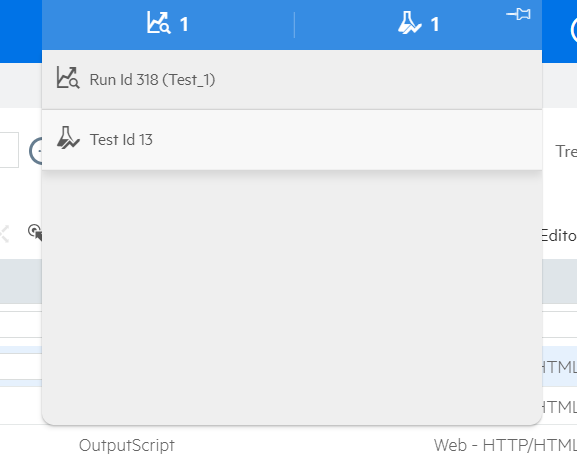
 for any open tabs. In collapsed mode, any tabs that are open are displayed below the masthead.
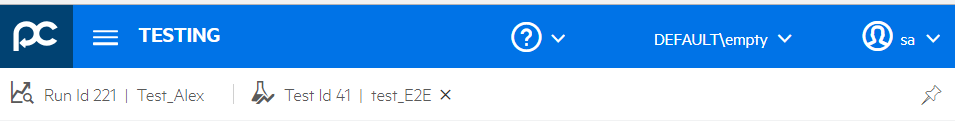

 Next steps: