Share this page


The Configuration tab in the Analysis View module and the graph configuration window in the project reports' Configuration tab enable you to select data to be included in a graph.
ALM Editions: Cross project graphs are not available for Quality Center Enterprise Edition, Quality Center Community Edition, or Quality Center Express Edition. For information about ALM editions and their functionality, see ALM Editions. To find out what edition of ALM you are using, ask your ALM site administrator.
How to access configuration tab/window of graphs
Configuration tab:
Use one of the following:
- In the Analysis View module, select a graph, and click the Configuration tab.
-
If you have the required administrator permissions, in the Analysis View module's Analysis Menus tab, select a graph and click the Configuration tab.
Configuration window:
- On the ALM sidebar, under Dashboard, select Analysis View.
- Expand the analysis tree and select a project report.
- In the project report, select a section node.
- In the Graph Selection area, select a graph and click Configure.

How to configure entity or business view graphs
User interface elements for entity graphs and business view graphs are described below. The available configuration options depend on the graph type.
|
UI Element |
Graph Type |
Description |
|---|---|---|
| Business View | Business View |
Enables you to select a business view on which to base the graph. Click the browse button next to the box, and select the desired business view from the list and click OK. |
| Period | Entity (progress and trend graphs only) |
The time period covered by the graph. Select a time period from the drop-down list:
|
| Age | Entity (defect age graphs only) |
You can group all defects older than a certain period (for example, older than six months) in one column, and all defects more recent than that period in a second column. Alternatively, you can group the defects by all available periods.
|
| Resolution | Entity (progress and trend graphs only) |
The time interval at which data is grouped on the x-axis. |
| Complete Status | Entity (plan vs. actual V2 graphs only) | Specify the statuses that are treated as complete status. If the run status of a test instance is one of the specified values, ALM treats the test instance as completed. |
| Display | Entity (progress graphs only) |
|
|
Field |
Entity (cycle time by phase only) |
Select the field that defines status for cycle time by phase graphs. For example, if you want to define status by the Status system field, such as Open, Fixed, and Closed, then select Status for this field. You can also specify a user-defined field to define status. The user-defined field should meet the following requirements:
For details, see Customize project entities. |
| Phase Defined By | Entity (anomalies graphs only) |
Select the field that defines phases for anomalies graphs. For example, if you want to define phase by the Status system field, such as Open, Fixed, and Closed, then select Status for this field. You can also specify a user-defined field to define phases. The user-defined field should meet the following requirements:
For details, see Customize project entities. |
|
Stuck in Phase |
Entity (anomalies graphs only) |
Select a phase. The available values of this field depend on which field you use to define phases. For example, if you want to know how many defects remained in the Open status for a certain duration, select Status in the Phase Defined by field, and Open in the Stuck in Phase field. |
| Duration | Entity (anomalies graphs only) |
Specify the pending duration for defects that remained in the phase defined by the Stuck in Phase field. For example, if you want to know how many defects remained in the Open status for no less than 5 days, enter 5 in the >= field. |
| End Phase | Entity (cycle time by phase graphs only) |
Select one phase as the end phase that will not be shown in the graph or taken into account when calculating cycle time. The available values of this field depend on what you specified in the Calculation field. For example, if you select Status in the Calculation field, you may select phases such as Closed as the end phase, then closed defects will not be shown in the graph, and the time spent in the closed phase will not be included in defect cycle time. |
| Y-Axis |
|
Select the data that displays on the y-axis.
|
| X-Axis |
|
The information displayed along the x-axis of the graph. Tip: In cross-project graphs, select QC Projects to display the data by project. |
| Working Days | Entity (defect anomalies graphs only) | Select the working days. Non-workings days are not counted when calculating how long a defect remained in a specific phase. |
| Grouped |
|
Select a field to determine the information by which ALM groups data in the graph. You can group the data only by string or list fields. Tip: For cross-project graphs, select QC Projects to group the data by project. Progress or Trends graphs: If you set a filter on the same field as the Group By field, groups in the graphs may include values that you filtered out. This is because in progress and trend graphs the filter operates on current values, while groupings operate on historical values. For example, say the Group By field in a Defects graph is set to Status, and the current filter includes all defects whose status is Open. When the graph is generated, all previous statuses of the open defects, such as Rejected, will appear in the graph even if Rejected was not included in the filter. |
| Show 'Not Covered' parents | Entity (Requirements only) |
Choose whether to include parent requirements with a Not Covered status. |
| Show full path | Entity (summary graphs only) |
In summary graphs, if you select Subject, Plan: Subject, Test: Subject, or Test Set: Name in the X-Axis field, ALM displays the full path of the test subject folder. |
| Filter State |
Enables you to set dynamic filter conditions for graphs that are generated from within the Analysis menu in specific modules.
Available from: Analysis Menus tab only. You must have the required administrator permissions to view this tab. |
|
| Entity |
Set Filter. Enables you to filter the data according to the criteria you choose. For details, see Select Filter Condition Dialog Box. The current filter is displayed in the filter box. Note: Setting the filter to the same field as the Grouped By field, may cause historical data to appear in the graph. |
|
|
|
|
Clear Filter. Clears the current filter. |
| Base Filter |
Enables you to view the filter defined in the template project. Available from: a shared folder if a filter was shared from a template project. For details on sharing as templates across projects, For details, see Cross project customization. |
|


|
Business View |
Copy/Paste Filter Settings. Enables you to copy and paste filter settings from one Business View graph to another. This is useful for reproducing complex filters in several graphs. Note: You can perform this action only if the following conditions are met:
|
| <field filter table> | Business View |
Enables you to filter data for Business View graphs.
Note: Filter criteria for dates and strings must be preceded by an equals sign. |
|
Opens the Select Projects dialog box, enabling you to change the list of projects in the Cross Project Selection grid. For details, see Select Projects Dialog Box. Available from: Configuration tab (not available in the Analysis Menus tab) |
|
| Project Selection |
|
Projects included in the graph. To change the list of projects included in the graph, click the Select Projects button. Note: When working with Entity graphs, be aware of the following:
Available from: Configuration tab (not available in the Analysis Menus tab) |

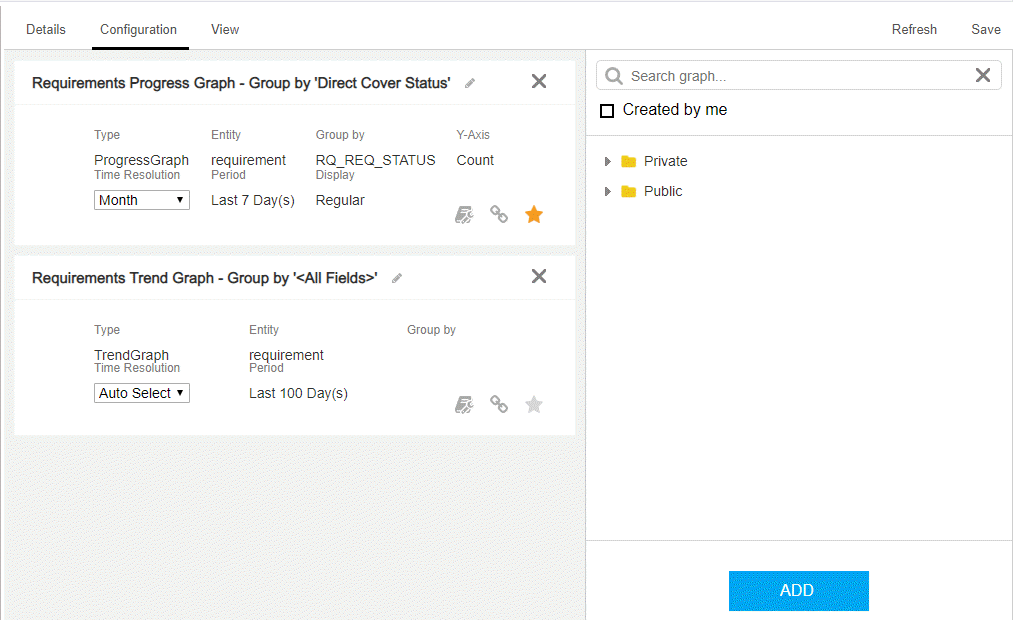
How to configure composite graphs
You configure a composite graph to control which graphs are compared in the composite graph and how they are displayed in the composite graph.
-
Select which graphs will be included in the composite graph.
- Select the graph from the right panel,
-
Drag and drop the graph to the middle gray area. Alternatively, click the Add button.
Note the following when adding graphs to a composite graph:
A composite graph can include up to 3 graphs. A composite graph can include up to 3 graphs, regardless of whether they are generated for the same project.
Builds, Code Change, and BV graphs are not supported by composite graphs. You cannot add Builds, Code Changes, or BV graphs to a composite graph. Restrictions for entity graphs Which types of entity graphs can coexist in a composite graph?
-
Time series graphs (graphs whose x-axis values are dates), such as trend, progress, and plan vs. actual graphs.
-
Non-time-series graphs (graphs whose x-axis values are text), such as age and summary graphs.
After you select a graph, the graphs of the incompatible graph types are grayed out in the graph tree.
The following entity graphs are not supported by composite graphs:
-
Planned vs. Actual (Test Run History)
-
Planned vs. Actual (Test Run History)
-
Test Execution Status Trend Graph
-
Search graphs: Use the search box to filter only the entity graphs that contains the search keyword in the graph title.
Created by me: Check this option to filter only the entity graphs you created.
 : Views the graph from the Analysis tree (go to the View tab of the graph).
 -
Edit how the selected graphs will be displayed in the composite graph.
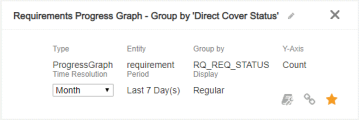
For each graph, you can do the following in the graph card.
Change graph title Click the edit icon next to the graph title to rename the graph.
It does not really change the graph title. The new name applies only when the graph is presented in the composite graph.
Set time resolution Applicable to progress and trend graphs only.
In the Time Resolution field, specify the time interval at which data is grouped on the x-axis.
If the graphs included in a composite graph have different time resolution settings, the composite graph listens to the time resolution of the primary graph.
View graph filters Hover over the filters icon (  ) to see the filters of the graph.
Set primary graph Click
 to set the graph as the primary graph. The primary graph by default has a darker shade than non-primary graphs in the composite graph.
By default, the first graph you add to the composite graph is the primary graph.
View graph in Analysis Click to view the graph from the Analysis tree (go to the View tab of the graph). It enables you to re-configure the graph if you want to have the graph present a different set of data in the composite graph.Change graph order Drag and drop the graph up or down.

 See also: