Share this page


You can view a saved entity graph in the View tab of the Analysis View module, and analyze the graph data.
Note: The View tab of a graph has an improved look and feel starting from ALM 15.50. If you want to use the classic view, ask your site admin to enable the view by using the ENABLE_CLASSIC_GRAPH_VIEW parameter.
The graph window supports the classic view only.
Set graph appearance
To customize the title, color, and display of a graph, in the View tab of the graph, click Set Graph Appearance to open the Graph Appearance dialog box.
| UI Element | Description |
|---|---|
| Title section |
Enables you to change the titles of the graph, the y-axis, or the x-axis.
|
| Layout section |
|
| Color |
Color Theme. Select a color theme for the graph. Groups in the graph will be automatically displayed in different colors under the color theme. If the graph has more than 6 groups, some groups will share the same colors. Group Color. Select colors for the groups in the graph. If it is a Test Execution - Planned vs. Actual graph, select any colors for the Plan and Actual lines. The settings of group color or source graph color override the color theme setting. Outer Color. Select a color for the area outside the graph. Inner Color. Select a color for the inner part of the graph. |
| Working Days
Available only for Test Execution - Planned vs. Actual graphs |
Select the working days. |
| Column Parameters
Available only for column charts |
Show Data Label. Whether or not to display labels for each column. A label can be number or text. Label Type. This option works only when Show Data Label is enabled. Select one of the following:
Label Position: This option works only when Show Data Label is enabled. Select where the labels are displayed: on the top, at the bottom, or in the middle of the column. |
| Others
Not available for pie charts |
Legend Position. Select where the graph legend is displayed. X-axis Label Direction. Select a text direction for the x-axis label. Sorting. Select in which order are the columns displayed in a chart. Available only for column charts. Date Format. Select a format for the dates in the x-axis. Available only for graphs whose x-axis values are dates, such as progress and trend graphs. |
|
UI Element |
Description |
|---|---|
| Titles tab |
Enables you to change the titles of the graph, the y-axis, or the x-axis. Font. Enables you to change a title's font or color. Reset Titles. Enables you to restore the original titles. Note: For a pie chart, you can only change the title of the graph. |
| Appearance tab |
Enables you to set the default format of your graph, modify the orientation of the labels at the base of the graph (for a column chart and a line chart only), determine the format in which dates are displayed on the x-axis, display the graph with a 3D effect, or change the colors of the various components in your graph. |
| Bar Parameters tab |
In bar charts, enables you to specify whether you want the values for each bar to be displayed. You can also adjust the bar width. If you specify that the values of each bar are to be displayed, you can change the data that is displayed for each bar, or its position relative to the bar. |
| Line Parameters tab |
In line charts, enables you to specify whether you want the line frame to be displayed. |

Set treemap appearance
You can customize the title and rectangles' colors of a treemap.
To set a treemap's appearance:
-
In the View tab of the treemap, click Set Graph Appearance
. -
In the Graph Title field, enter a new name for the treemap.
You cannot change the rectangle labels. The label of a rectangle is determined by the test set it represents.
-
In the Settings section, set the following for the treemap:
Failed ratio tolerant value
In the Failed Ratio > field, enter the tolerant value (an integer from 0 to 100) for the failed ratio. By default, it is 0.
Failed ratio refers to the percentage of failed tests out of all executed tests.
On the graph's Configuration tab, you can set which test statuses are treated as Failed and Executed. For details, see Configure test execution treemap graphs.
Note: To obtain a more objective test result, we recommend you set the tolerant value to an integer bigger than 0. This can help you ignore some failures that are caused by external factors, such as unstable testing environments.
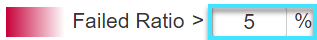
Color for test sets where the failed ratio is higher than the tolerant value
Click the color field to select a color theme for test sets where the failed ratio is higher than the specified tolerant value. By default, it is red.
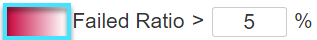
The test set with the highest failed ratio is displayed in the selected color. Test sets with lower failed ratios in this ranger are displayed in lighter tints of the color.
Color for test sets where the failed ratio is not higher than the tolerant value
Click the color field to select a color theme for test sets where the failed ratio is lower than or equal to the specified tolerant value. By default, it is green.
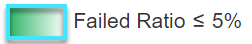
The test set with a zero failed ratio is displayed in the selected color. Test sets with higher failed ratios in this range are displayed in lighter tints of the color.
Color for test sets where no test has been executed
Click the color field to select a color for test sets where no test has been executed.
You can group values of the field selected in the Grouped By or the X-axis field, and display the combined data as one category.
To edit categories of an entity graph:
-
In the View tab of the graph, click Edit Categories
 to open the Edit Categories dialog box.
-
To group values of the field selected in the X-axis field, select Edit X-Axis Categories from the drop-down list. This option is available only for summary graphs, Business View graphs, and Requirements Coverage graphs.
To group values of the field selected in the Group By field, select Edit Group by Categories from the drop-down list.
By default, all X-axis or group-by field values are listed under the <No Category> group.
-
Create new categories.
To create a new category, in the New category name text box, enter a name for the category, and click
 .
. -
Add groups into new categories.
You can add groups into a new category in either of the following way.
Drag and drop groups into the new category - In the top-right corner, click
 to open the Category view.
 - Drag and drop the groups from the <No Category> area or any existing categories area to the new category area.
Assign the new category to target groups - In the top-right corner, click
 to open the Grid view.
 -
In the Categories column, select the new category name for the groups that you want to add.
The number displayed before each category name indicates how many groups are added under this category.
- In the top-right corner, click
-
Click Save to save all the categories.
To delete a specific category, in the Category view, click the delete icon in the category line.
To delete all categories, click Reset Categories.
Enable new graph look in email for entity graphs
If you want to send a Test Execution Planned vs. Actual graph to email, or if you want other types of entity graphs to be displayed in the new graph look, enable the new graph look in email before you send these graphs by email.
For details, see Enable new graph look in email.
Show/hide total values in progress graphs
Available in versions: 17.0.1 and later
You can show or hide the <Total> category for a progress graph to represent the sum of all the other Group By categories.
To show the <Total> category, click the Show Total Value button  .
.
To hide the <Total> category, click the Hide Total Values button  .
.
Note: If you create a category and also name it <Total>, the Show/Hide Total Value toggle does not work. The Total line as a result of turning on the Show Total Value toggle disappears.
Therefore, if you want to use the Show Total Value toggle to display the total of all the other Group By categories, do not use <Total> as your custom category name.
To change the color of the total values line:
-
Click Set Graph Appearance
to open the Graph Appearance dialog box. -
In the Color section, select a color theme, from the Group Color drop-down list, select <Total>, and select a color for the total values line.
For details, see Set graph appearance.
Drill down to graph data
In a bar or pie chart, you can drill down to the records represented by a selected bar or segment, and view details of individual records.
To drill down to a graph:
-
In the View tab of the graph, click a segment or bar in the graph.
-
If the segment or bar represents records from multiple projects, the Project Selection dialog box opens. Select a project.
-
If you selected to view data from another project, or if the segment or bar represents records from only another project, the project opens in a separate browser window. If applicable, you are prompted to log in. The records are displayed in the relevant ALM module.
-
If the segment or bar represents records from only the current project, or if you selected to view data from the current project, the records are displayed in the Drill Down Results dialog box.
UI Element
Description
<Segment parameters> Located above the data grid, displays parameters of the selected graph area, and the number of records displayed.
<Data grid> A list of the records that are included in the selected graph area.
To open a particular record, double-click a record. The <Module> Details dialog box opens, enabling you to view or edit the record. Use the navigation buttons to browse through the drill down results.

View results in the <module name> module. Opens the results from the appropriate module. If a filter is currently applied to this module, it will be replaced.
Available for the following modules: Requirements, Business Components, Test Plan, Test Lab,Test Runs and Defects.

Export. Opens the Export Grid Data dialog box, enabling you to export the records as a text file, Microsoft Excel worksheet, Microsoft Word document, or HTML document.
Select one of the following options:
-
All. Exports all records in the grid.
-
Selected. Exports selected records in the grid.

Select Columns. Opens the Select Columns dialog box, enabling you to determine which fields to display in the data grid, and their order. For details, see Select Columns/Select Fields Dialog Box.
-
Share a graph
You share a graph to allow ALM users or others to view read-only versions of graphs outside ALM.
To share a graph:
-
In the analysis tree, right-click the graph, and select Share Analysis Item.
Note:
-
This option is not available in the Analysis Menus tab.
-
You cannot share Requirement Coverage trend graphs.
-
-
In the Share Analysis Item dialog box, select a share option and click OK.
UI Element
Description
Copy Analysis Item URL (Authentication Required) Copies the URL of the selected graph to the clipboard.
Users are required to enter an ALM user name and password to view the graph.
Copy Analysis Item Public URL Copies the public URL of the selected graph or report to the clipboard.
No authentication is required.
This option requires that you have share permissions for the selected analysis item. For more details on setting permissions, see Manage user groups and permissions.
Reset Analysis Item Public URL If you previously selected Copy Analysis Item Public URL, selecting this option blocks access to the public read-only version of the selected graph.
This option requires that you have share permissions for the selected analysis item. For more details on setting permissions, see Manage user groups and permissions.
-
Paste the URL in a website or email.
Note: You can adjust the width and height of a graph by adding the &width=xx or &height=xx attributes to the end of the URL.
-
Click the URL to open a read-only version of the graph in a Web browser. Each time you access the graph, after set intervals, it displays the most up-to-date information.
Note: You can change the frequency at which graph data is updated by adding and configuring the GRAPH_RESULT_LIFESPAN site configuration parameter. For details, see Set configuration parameters.
 See also: