Share this page


View running tests in the online screen
This topic describes the Performance Test Run page which displays details of the running performance tests, and enables you to perform all runtime test run actions.
Tip: You can also view performance measurements for tests that have finished running in offline graphs. For details, see View finished test run results offline.
Access the Performance Test Run page
The Performance Test Run page opens as a tab in LoadRunner Enterprise automatically when a performance test starts, or when you join a running test from LoadRunner Enterprise.


Summary area
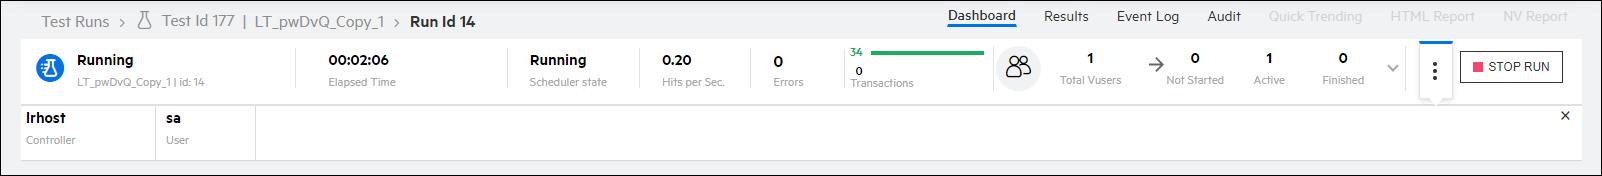
The Summary pane (displayed in the upper section of the Performance Test Run page) displays a synopsis of the running performance test.
User interface:
User interface elements are described below:
|
UI Elements |
Description |
|---|---|
| Test Runs > <Test name> > <Run ID> |
Name and ID of the running test. Click the Test Name link to display the test in the Performance Test Designer. |
| Tabs | |
| Dashboard |
Displays details of running performance tests and measurements for tests that have finished running. |
| Results |
Displays result files for the test run. For details, see Download and upload result files. Note: Available after the run has finished. |
| Event log | Displays the event log for the test run. For details, see View test run event logs. |
| Audit | Displays a list of changes made to the test. For details, see View changes made to a test run. |
| Quick Trending |
Displays a summary of failed transactions. You can drill down on transactions and compare them against previous runs to help identify trends and resolve issues. For details, see Perform quick trending analysis. Note: Available only if you configured an external analysis server and assigned the project to the server. For details, see Configure external InfluxDB analysis servers. |
| HTML Report |
Opens an HTML version of the Analysis Summary report, which analyzes the data collected during the performance test run. The report provides general information about the performance test, lists statistics about the test run, and provides links to graphs containing test run data. For more details regarding the summary report, see the LoadRunner Professional Help Center. Note: Available after the run has finished, and only if results have been collated and analyzed (when test is in Finished state). |
| NV Insights report |
Opens the NV Insights report for the selected test run. For details, see View finished test run results offline. Note: Available after the run has finished, and only if NV Insights is enabled and included in the performance test. |
| Run Details | |
| <state> |
The current run state (for example Running or Down), and the name and ID of the test. |
| Elapsed Time |
The amount of time since the test began running. |
| Scheduler state |
The current state of the scheduler. |
| Hits per Sec |
How many hits (HTTP requests) there have been to the web server by Vusers during each second of the test run. |
| Errors |
The number of Vuser errors that occurred during the test run. If there are errors, click the number of errors link to view details in the Messages view. For details, see Messages view. |
| Transactions |
The number of completed, successful (green) and unsuccessful (red) transactions performed during the test run. Click the transactions link to view details in the Transactions grid. For details, see Transactions view.
Tip: You can view details of failed transactions in the test run (via Quick Trending in Test Runs or Test Management), and perform trending analysis by drilling down and investigating specific transactions related to the run. For details, see Perform quick trending analysis. |
| Total Vusers |
Displays the total number of Vusers in the test, and a breakdown of the current Vuser status: Not Started, Active, and Finished. Click |

|
Opens an area below the summary area, which displays the following:
|
|
Stop Run/Stop Now. Enables you to stop a running performance test.
|
 to display a breakdown of the statuses of the Vusers in the performance test. For details, see
 Toolbar buttons
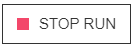
The Performance Test Run toolbar is located in the upper area of the Performance Test Run page.
User interface:
|
UI Elements |
Description |
|---|---|
| Tabs/Views | |
| Graphs | Displays the Graphs view (displayed by default). For details, see Graphs view. |
|
Groups |
Displays the Groups view. For details, see Groups view. |
|
Transactions |
Displays the Transactions view. For details, see Transactions view. |
|
Messages |
Displays the Messages view. For details, see Messages view. |
| Monitors |
Displays the Runtime Monitors and Monitors Over Firewall views. For details, see Monitors view. |
| Toolbar Buttons | |
|
Vusers Details. Displays specific details for each Vuser in the performance test, and enables you to run or stop individual Vusers irrespective of their defined schedules. For user interface details, see View Vuser details. |
|
|
Run Vusers. Enables you to run additional Vusers during the course of a performance test. That is, you can run Vusers that are not included in the test's original defined schedule. For details, see Run Vusers. |
|
|
Load Generators. Enables you to manage the load generator in the performance test. For details, see Manage load generators. |
|
|
Timeslot Duration. Enables you to extend or shorten the duration of the performance test. For user interface details, see Change timeslot duration. |
|

|
More. Click the arrow adjacent to the button for the following options:
|
|
Search. Enables filtering the information being displayed in each of the views by the search string. |
|


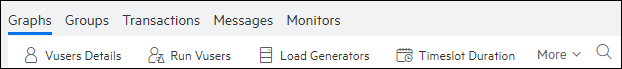
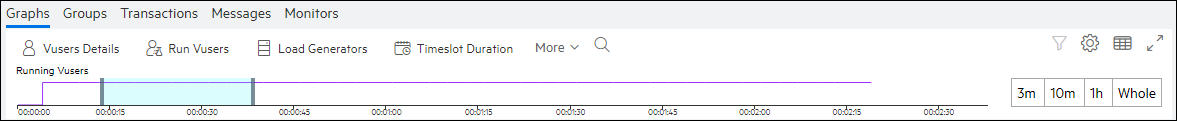
Graphs view
The online graphs display performance measurements for those resources being monitored in a performance test.
To access:
Select the Graphs tab (the Graphs view is displayed by default in the Performance Test Run page).
For details on the tabs available from the Graphs view, see Graphs Tab.
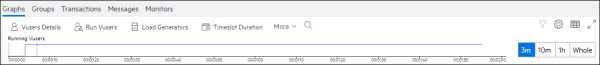
To adjust time range in graph:
You can adjust the time range displayed in the graphs view by:
-
Selecting a granularity range to display (3 minutes, 10 minutes, 1 hour, or whole).
-
Using the slider to focus on a particular time period. Pull the sliders on both sides to focus on a particular time period. You can also move the selection (maintaining the same granularity), and select a new range in the timeline.

Note: To ensure the correct real time for running the performance test is displayed in the online graph, the time zone on the LoadRunner Enterprise Server and any external analysis database servers must all be synchronized.
User interface:
User interface elements are described below:


 Expand Legend. Expands the area of the legend.
 Legend Options. (Displayed on left-hand side of the Name column.) The following options are available:
 appears next to measurements that contain an anomaly.
  Set as Favorite icon.) The following options are available:
 <page list>. (Displayed only for graphs that have at least 20 measurements.) Enables you to move to the first, last, or a specific graph measurements page.
This tab displays a list of the configured online graphs. You can select which graphs to display in the Online Graphs pane.
To access:
On the right of the Online Graphs pane, click ![]() and select Graphs.
and select Graphs.
User interface:
User interface elements are described below:
 Indicates the graph is currently being displayed in the Online Graphs pane.
Groups view
The Groups view displays the statuses of the Vusers in the performance test.
To access:
Select the Groups tab.
User interface:
User interface elements are described below:
Transactions view
The Transactions view of the Details pane displays how many transactions have been executed successfully or unsuccessfully.
To access:
Select the Transactions tab.
User interface:
User interface elements are described below:
|
UI Elements |
Description |
|---|---|
| Name |
The transaction name. For details on transaction names, see Transaction naming conventions. |
| Passed |
The number of times the transaction passed. |
| Failed |
The number of times the transaction failed. |
| Stopped |
The number of times the transaction stopped. |
| Success Rate % |
The transactions success rate percentage. |
| TPS |
The number of times per second the transaction has run. |
Tip: You can view details of failed transactions in the test run (via Quick Trending in Test Runs or Test Management), and perform trending analysis by drilling down and investigating specific transactions related to the run. For details, see Perform quick trending analysis.
Messages view
The Messages view displays error, warning, debug, and output messages that are sent to the Controller by the Vusers and load generators during a test run.
To access:
Select the Messages tab.
User interface:
User interface elements are described below:
|
UI Elements |
Description |
|---|---|
|
Group by |
Enables grouping messages by Code, Message, Host, Script, or Vuser. After you have selected a grouping, the grid displays a drilled down view. You can click a blue link to filter grid data by the selected value. For example, if data is grouped by Code and you drill down on a particular code, the grid displays all messages for the selected code. Note:
|
| Type |
Enables filtering the messages by a specific message type:
Default: All Types |
| Sort by |
Enables sorting column values by Time, Type, Code, Message, Host, Script, or Vuser. After selecting a sort value, the latest 50 messages are displayed on the page. You can scroll to see additional pages (each page displays the next 50 messages). Click Note: When you change the sort order in the online screen, scrolling is limited to displaying the first 500 rows only, according to the selected sort order. Offline view retains full sorting functionality, enabling you to scroll all messages (in rows of 50). |
| Vuser Log |
Select a row in the grid and click Vuser Log. The Vuser activity log opens, enabling you to view a list of messages per individual Vuser. The log contains the following information:
Note:
|
| Clear All Messages |
Clears all messages. Note: This option is not available in the offline results view. |
| Refresh All |
Select the refresh option:
Note: This option is not available in the offline results view. |
| Time |
The time the message was generated. Note: Displays the time according to the UTC time zone if Time Display > Custom time zone was selected in the Graphs view. For details, see Time Display. |
| Type |
The type of message. For details, see Type above. |
| Code | The message code. |
| Message |
The received message. To copy a message to the clipboard, right-click the message and select Copy to clipboard. |
| Host |
The host that generated the message. You can click a host link to group messages by the selected host value. |
| Script | The script that generated the message. You can click a script link to group messages by the selected script value. |
| Action | The action in the script where the message was generated. |
| Line | The line in the script where the message was generated. |
| Iteration | The iteration during which the message was generated. |
| Vuser | The Vuser which generated the message. You can click a Vuser link to group messages by the selected Vuser value. |
| Total Messages |
The total number of messages received for the selected grouping. Note: Displayed only when messages are grouped. |
| Total Vusers |
Displays the total number of Vusers for the selected grouping. Note: Displayed only when messages are grouped. |
 Change sort order are enabled; otherwise Sort by and
 Monitors view
The Monitors view displays monitors from all the monitor profiles and over firewall agents that are associated with the selected test. You can add new monitors to the test from this view.
Note: Any monitors that you add to the test or updates you make to existing monitors from this tab won’t affect the monitor profile, and are discarded after the test run.
To access:
-
Select the Monitors tab.
-
To view monitor profiles associated to the test or to add a new monitor, select the Runtime Monitors tab.
For details on adding and managing monitors while a test is running, see Manage runtime monitors.
-
To view all monitor over firewall agents associated to the test or to add a new monitor over firewall agent, select the Monitors Over Firewall tab.
For details on adding a new monitor over firewall agent, see Create a monitor over firewall agent profile.
 See also: