Share this page


This section describes the workflow for running a performance test, and the available options for managing the test run.


Performance test run flow
After planning, designing and scheduling your performance test, you run it to create load on your application and to test its performance.
The following table explains the various stages of the test run flow.
|
Run stage |
Description |
|---|---|
|
Start of run |
At the start of the run, the Controller checks the test configuration information, invokes the applications that were selected to run with the test, and then distributes each Vuser script to its designated load generator. When the Vusers are ready, they start running their scripts. |
|
During run |
During a test run, you can use online monitors to view performance test runs. LoadRunner Enterprise displays information about the load that Vusers generate on your web server and other applications in real time during test execution. You can also drill down to see which Vuser actions are causing the application problems. The online graphs display performance data collected by the monitors. You use this information to isolate potential problem areas in your system. |
|
End of run |
The test run ends when all the Vusers have completed their scripts, when the duration runs out, or when you terminate it. At the conclusion of the performance test, you can view a summary and graphs of the data collected from these monitors during the test run. For details, see View test data and results. |

Manage a performance test run
This task describes the workflow for running a performance test, and the available options for managing the test run.
-
Make sure that the performance test you want to run is valid. For details, see Design a test.
-
-
In the LoadRunner Enterprise masthead, click the module name or the dropdown arrow and select Test Management (under Testing). Create a test set that includes an instance of the performance test you want to run. For user interface details, see the Create, edit, or assign a test set.
-
In the Performance Test Set pane, select a performance test and click Run Test. The Run Test dialog box opens, enabling you to reserve a timeslot for the test run. For details, see Run Test.
-
Select an available timeslot and click Run.
The Initializing Run page opens, and displays the performance test initialization steps performed by LoadRunner Enterprise, and the status for each step. For details, see Initialization steps.
If each initialization step is completed successfully, the performance test starts running and the Performance Test Run page opens.
-
-
Manage Vusers during the test run - optional
You can override the defined schedules and manually control the behavior of Vusers during a performance test run.
For details on updating the timeslot, see Change timeslot duration.
For details on managing Vusers, see Manage Vusers during a run.
-
Manage monitors, monitor over firewall machines, and load generators during the test run
You can perform actions related to the status and management of runtime monitors, monitor over firewall machines, and load generators during a performance test run.
For task details, see Manage monitors and load generators during a run.
-
Modify timeslot duration during the test run
You can extend or shorten the duration of the current timeslot during a performance test run. For details, see Change timeslot duration.
-
Manually stop the test run and collate run results - optional
You can manually stop a test run, for example, if you want to delay data collection and analysis until a more convenient time.
Action Description Stop the test run gradually On the Performance Test Run page, click Stop Run
 . The Stop Run dialog box opens, which prompts you to select a post-run collation option (unless a post-run action was set by the system administrator for the project). Select an option, and then click Stop. All Vusers in the test move to the Gradual Exiting state.
 -
Do not collate. Frees the machines immediately after the test ends. You can collate and analyze results at a later point from the Results tab.
Note: This option is not available when the collate at runtime option is selected in Test Options. For details, see Configure collate options.
-
Collate results. LoadRunner Enterprise collates the run data from the load generators. After data is collated, LoadRunner Enterprise automatically deletes the temporary results from the load generators. You can download the raw results from the Results tab, or manually analyze results at a later point from the Results tab. This is the default setting.
-
Collate and analyze results. LoadRunner Enterprise collates the run data from the load generators and generates analysis data. After data is collated, LoadRunner Enterprise automatically deletes the temporary results from the load generators and controllers. You can display the results using analysis tools such as graphs and reports, or download the results for analysis on a local machine. This option takes the most time.
-
Free current timeslot. Frees the current timeslot once the test has stopped.
Note: When this option is not selected, timeslots with less than 27 minutes remaining are automatically released.
Stop the test run immediately After clicking the Stop button in the Stop Run dialog box, the Stop Run button on the Performance Test Run page changes to Stop Now
 . Click the button to stop all Vusers immediately.
 -
-
View test results and manage result files
You view and manage result files generated by the test run in the Test Runs view. For user interface details, see Manage test runs and results.
You can also view performance measurements and results offline in the Offline Results page. For details, see View finished test run results offline.
-
You use LoadRunner Analysis to analyze test run data offline, from any computer on which Analysis is installed. For information on how to access your project from Analysis, see the LoadRunner Analysis.
If there are SLAs defined for the performance test, you can calculate SLA results, and view these results in the Analysis Summary report and SLA report which can be accessed from the Test Run's Result tab. For details, see Manage test results.
-
View performance improvements and regressions
You can use the Trend Reports feature to view improvements or regressions in performance across several test runs. For details, see Trend reports.
-
Generate reports
You can generate reports to monitor and manage the usage of LoadRunner Enterprise resources. For details, see Reports.
Initialization steps
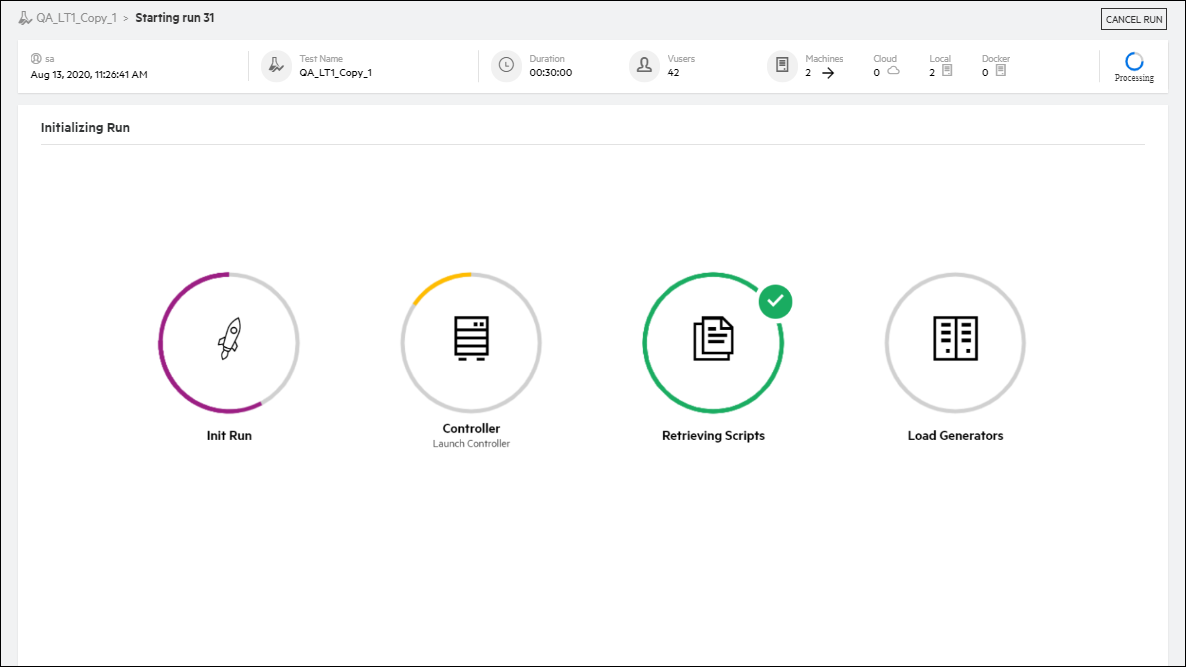
When you start a performance test, the Initializing Run page opens, displaying the performance test initialization steps performed by LoadRunner Enterprise, and the status for each step. Hover over a step to view detailed information.
For cloud tests, the Initializing Run page also displays cloud locations, provisioning status, and a progress indicator.
Example:
Initializing Run page for a test with on-premises load generators:
Initializing Run page for a test with load generators provisioned on the cloud:
|
UI Elements |
Description |
|---|---|
| <User> | The user responsible for running the test. |
| <Run Date and Time> | The date and time of the test run. |
| Test Name | The name of the test. |
| Duration | The time that the test takes to run. |
| Vusers | The number of Vusers reserved for the timeslot. |
| Machines | The number of load generators (without Controller) requested for this test broken down by host type: Cloud, Local, and Docker. |
| <Initialization status> |
Displays the initialization status: Processing, Passed, or Failed. |
| <Initializing Run steps> |
Displays test initialization step progress (indicates whether the step passed or failed).
|
| <Error Messages> |
Error messages are displayed if a step fails. These error messages can also be viewed from the Event Log. For details, see View test run event logs.
|
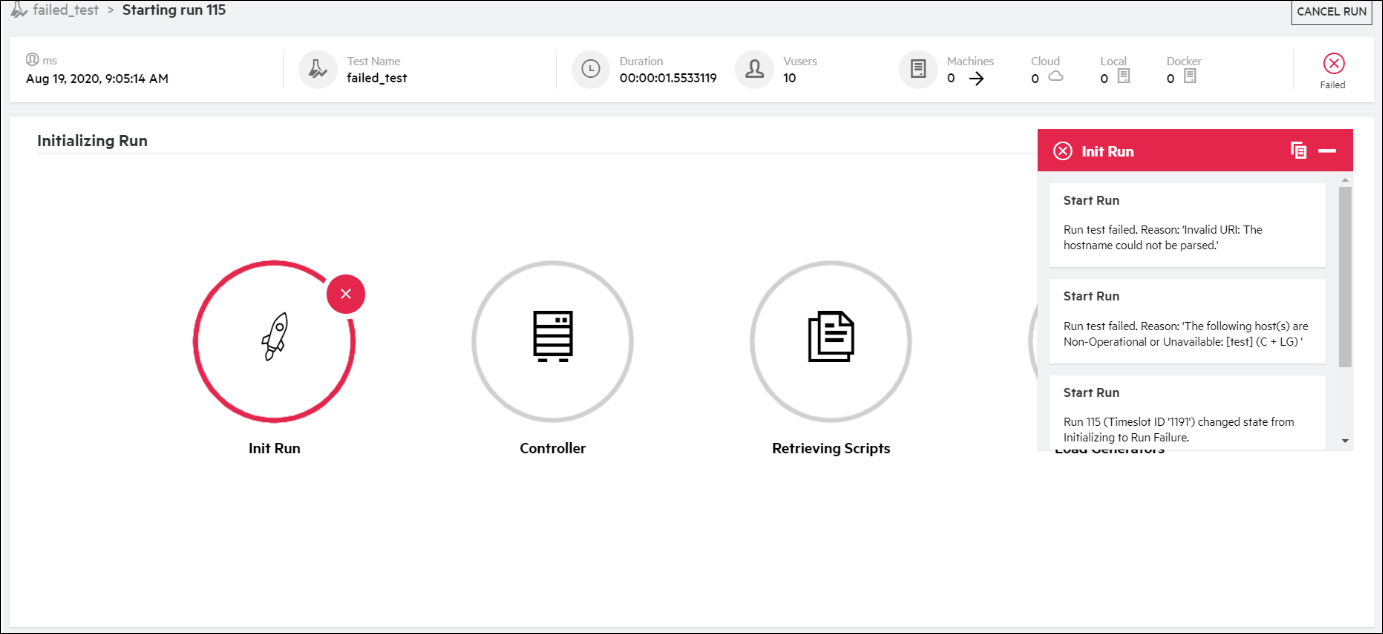
Troubleshoot start run failure
Problem Description: Starting a performance test fails with a timeout error in the Launch Controller step.
This can be caused by the LoadRunner Enterprise system user not having COM access permissions to start a test, even if the user is in the Administrators group (where the Administrators group lacks the default COM access permissions for the COM machine wide security configuration).
Troubleshooting: Add the LoadRunner Enterprise system user to the local Distributed COM Users group. All members of this group have local launch and access permissions for COM objects being used by the product.
 Next steps: