Share this page


Chaos testing
You can add disruption events from chaos engineering platforms to your performance tests. These events provide simulated attacks on your services and environments.
About chaos testing
Chaos testing enables you to see how your system responds under stress. By incorporating simulated attacks from chaos engineering platforms into your LoadRunner Enterprise tests, you can determine the impact of potential failures on your applications.
The simulated attacks can be on different technologies and components, for example, databases, web servers, CPU, or memory. To trigger the attacks, you add disruption events to your LoadRunner Enterprise test. When you run the test, the micro service component, EventsHandlerMicroservice, sends a request to the chaos platform to execute the predefined attacks. This enables the attacks to be launched on the system in parallel to running the LoadRunner Enterprise test.
An attack generally impacts the regular workflow, limiting responses or reducing performance. For example, the web server may work slower than usual, and there may be fewer successful transactions. You can compare responses when running your LoadRunner Enterprise test without attacks, and running when the system is stressed.
Chaos engineering platforms
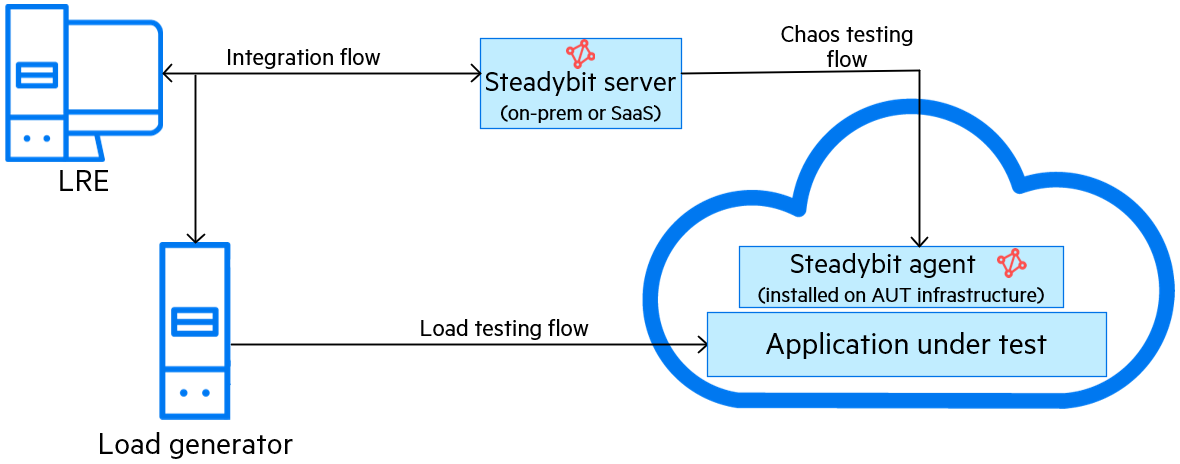
LoadRunner Enterprise works with Steadybit on public cloud, or on-premises from a private cloud platform. In Steadybit, you define experiments containing multiple attacks, and add the Steadybit experiments to your LoadRunner Enterprise test.
The Steadybit agent must run on the AUT machines. LoadRunner Enterprise then uses integrated Steadybit APIs to coordinate the chaos testing.
When working with Steadybit, it is recommended to define multiple attacks in one experiment, rather than running multiple shorter experiments one after the other.
Tip: Read more about chaos engineering with LoadRunner Professional in this blog: What is Chaos Engineering?

Add disruption event provider
You connect the attack scenarios from your disruption events provider to LoadRunner Enterprise tests, to run in parallel with the scripts.
To integrate Steadybit tests:
-
Set up and configure your Steadybit environment for the application you are testing. Make sure to use Steadybit team access tokens which map to the permissions of a team member.
-
Test the connection between the agent and the chaos platform before running the performance test.
-
In LoadRunner Enterprise Administration, select Configuration > Integrations > Disruption Providers.
-
Open the Steadybit panel and click Add Disruption Provider
 .
. -
In the New Provider page, enter a logical name for the disruption events provider.
-
Enter the API Key of the provider. This key is saved encrypted.
-
Select the provider's location:
-
If working with a private cloud platform, select On-Prem and enter the server URL (IP address and port if relevant).
-
If working with the default environment, select Default. The default server URL is used:
https://platform.steadybit.com/api. This field is read-only. The default URL is not hard-coded and must be configured in the internal configuration.
-
-
(Optional) Enter the team and description of the event provider.
-
To test the connection to the Steadybit environment, click Test Connection.
Note: Test connection is only available when all required data has been filled.
-
Click Save to add the provider to LoadRunner Enterprise.
Assign disruption event provider to projects
You can assign disruption providers to different projects.
Note:
-
You can assign only one chaos server per project.
-
You can also assign a chaos server to a project from the Projects page. For details, see Manage the disruption provider assigned to a project.
To assign an event provider to projects:
-
Prerequisite: Integrate an event provider with LoadRunner Enterprise. For details, see Add disruption event provider.
-
In the Linked Projects area, click
 Assign to open the Assign Projects dialog box.
-
Select the projects to which you want to assign the disruption events provider, and click Assign. The selected projects are added to the Linked Projects grid.
-
You can view project details (the project ID, name, and domain in which the project was created), and add or remove linked projects using the Linked Projects grid.
Add disruption events to a test
You can add disruption events to a performance test from the Disruption Events tab in the performance test designer.
Note: The Disruption Events tab is unavailable in the Performance Test Designer if no chaos server is assigned to the project.
To add disruption events to a test:
-
Prerequisites:
-
Integrate an event provider with LoadRunner Enterprise. For details, see Add disruption event provider.
-
Assign an event provider to the project. For details, see Assign disruption event provider to projects.
-
-
In the LoadRunner Enterprise masthead, click the module name or the dropdown arrow and select Test Management.
-
Select a performance test in the test management tree, and click Edit Test.
-
In the Disruption Events tab, click
Add Events. The Add Events dialog box opens, displaying the list of available events from the chaos server that is assigned to the project. The table displays the name of the event, the attack type, and the event creator. -
Select the disruption events you want to run for the current test from the grid.
-
You can use
 to search for events by name. This filters the list by your search term. Events that have already been added to the test are not listed (to prevent adding duplicate events).
 -
You can only select events that have Active state.
-
You can hover over an experiment name to see a description, if a description was added in Steadybit. You can also hover over an experiment type, to see a list of all actions it contains.
Click Add to add the selected events to the events grid. The grid displays the event name, platform, start time, and duration.
-
-
(Optional) Define the required start time for each event.
Tip: We recommend setting a different start time for each event, and to avoid scheduling events to overlap because this can result in unexpected behavior. Duration can only be changed from the Steadybit platform.
-
To schedule the start time for an event, double-click the event's Start Time and edit it as required.
To set the required start time for multiple events, select the events for which you want to schedule a start time, click
 Update Start Time in the toolbar, enter a start time in the dropdown box, and click Apply.
The start time is applied to all the selected events.
Update Start Time in the toolbar, enter a start time in the dropdown box, and click Apply.
The start time is applied to all the selected events.The start time is relative to the overall test scenario start time. The end time automatically adjusts when you modify the start time, based on the duration of the event.
-
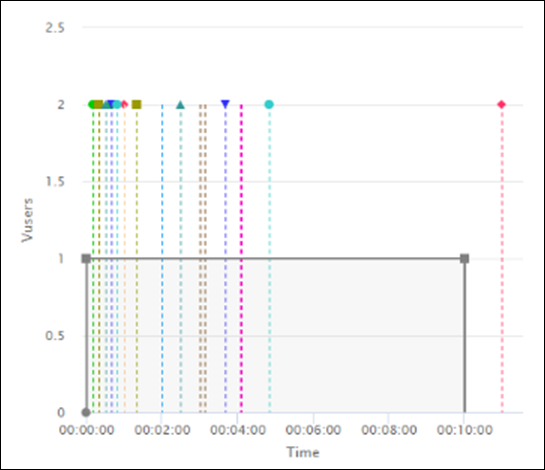
The scheduling graph in the lower-right pane shows when each selected event is due to start and end, against the global Vusers schedule for the performance test. Select an event from the legend to highlight the event lines in the graph.

Note:
-
The smallest time unit that is supported for disruption events is seconds.
-
All events that are present are added to the test unless they are inactive, already running, or missing. Events that are already running or are missing are displayed in red in the graph.
-
-
Click Save.
Note: A warning is displayed if:
-
you select duplicate events in the list (events running the same attacks).
-
events overlap, which may result in one event disrupting the other.
-
the end time for an event is after the performance test run time. In this case, the event is forcefully stopped when the test run ends.
The events will still run despite the warning, if you choose to leave your configuration as defined.
-
-
Run the performance test.
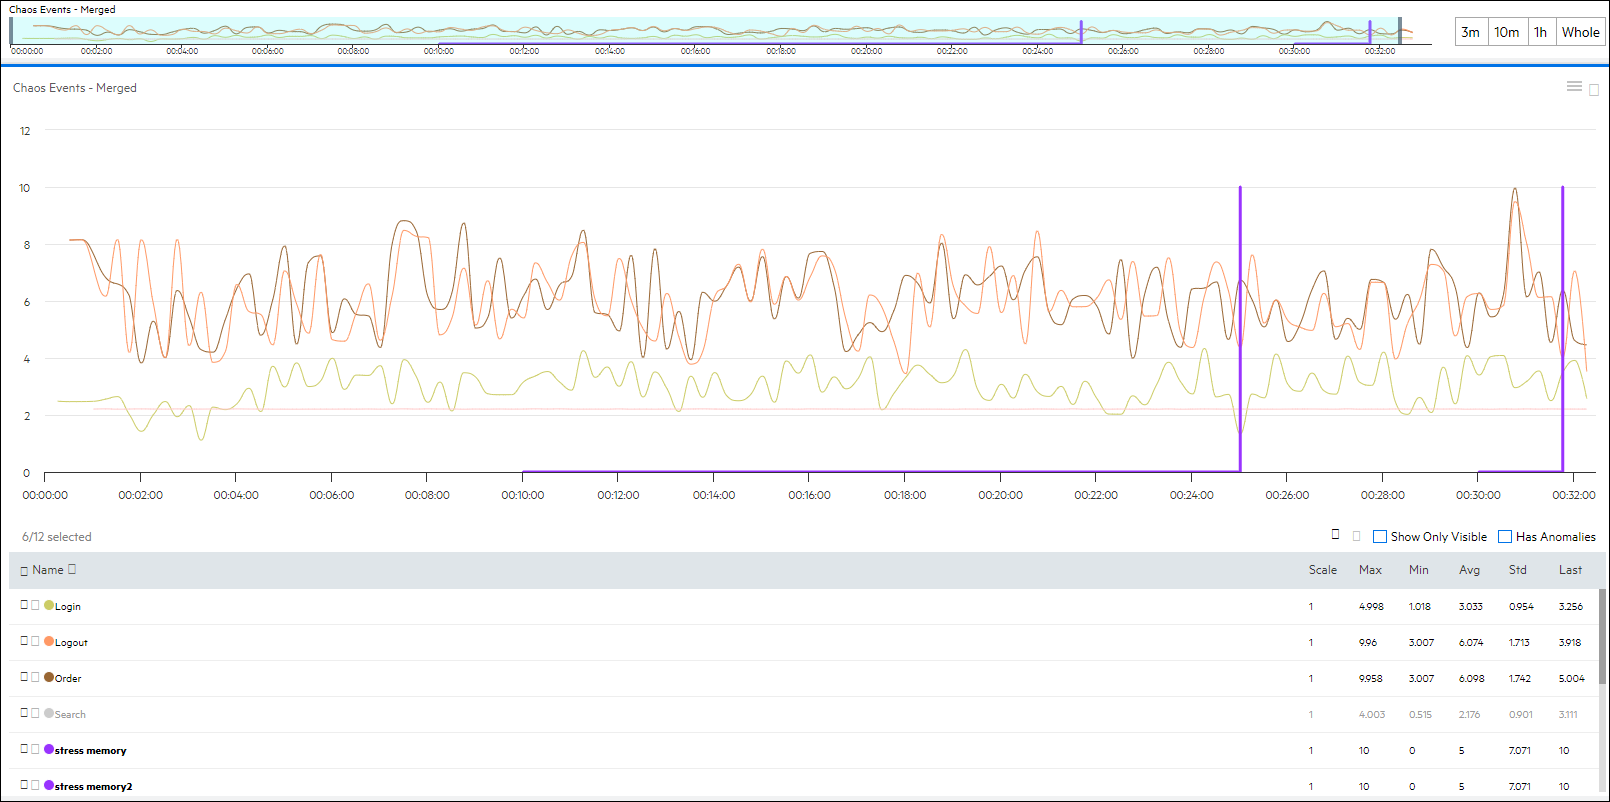
During the test run, the actual start and end times for each event are displayed as bars on the Disruption Events graph, enabling you to see how the chaos event impacts the monitored machine.
Click on the bars to highlight them and display the event name.
Note: In the graph settings, you can configure to display or hide the event bars for each individual graph. You can also display or hide for all graphs in the global graph settings.
You can view notifications for when each disruption event starts and stops in the Messages view. For details, see Messages view. This view also reports if there is any error with the event run.
-
After the performance test run, view the graph in the offline results or in Analysis. The Chaos Events graph is automatically displayed, showing data for the disruption events.
The event start and end times are also shown in the Summary Report. For details, see HTML Report.
Remove disruption events from a test
You can remove disruption events from a performance test.
To remove events from a test:
-
In the LoadRunner Enterprise masthead, click the module name or the dropdown arrow and select Test Management.
-
Select the performance test in the test management tree from which you want to remove events, and click Edit Test.
-
Open the Disruption Events tab.
-
Select the events that you want to remove from the test and click
 Delete.
Deactivate a disruption event
You can deactivate an event to make it temporarily unavailable in a test.
For example, you might want to run a specific test with simulated chaos attacks, and then deactivate the event to run the same test without those attacks.
To deactivate a disruption event:
-
In the LoadRunner Enterprise masthead, click the module name or the dropdown arrow and select Test Management.
-
In the test management tree, select the performance test from which you want to deactivate events, and click Edit Test.
-
Open the Disruption Events tab.
-
Select the events that you want to deactivate from the test and click
 Deactivate.
 -
Click OK to confirm. The selected events are deactivated (grayed out in the Events list), but are not deleted from the server.
To re-activate events, repeat the previous step and click
Activate Event.
Disruption event logs
You can view the logs for the disruption events:
-
Microservice-related logs: <LRE root folder>\Logs\EventsHandlerSrv\events_handler.log
-
Controller-related logs: %TEMP%\lr_disruption_events_err.log
Logging levels are set in these files:
-
%LR_PATH%\bin\disruption\*log
-
%LR_PATH%\bin\disruption\*config
The log levels, in increasing priority level, are as follows:
| .*config files | .*json files | Recommended values |
|---|---|---|
| All | Trace | |
| Debug | Debug | For debugging |
| Info | Information | |
| Warn | Warning | For regular workflow |
| Error | Error | |
| Fatal | Critical | |
| Off | None |
For more information, see the official documentation for Apache log4net and for .NET Core.
Notes and limitations
This section describes notes and limitations when using chaos testing in performance tests.
-
Tests configured to run with a Goal-Oriented schedule do not support chaos tests; the Disruption Providers tab is unavailable.
-
Events are not displayed in the graph until their duration ends. For example, an event that starts in the second minute and lasts three minutes is not displayed until the fifth minute of the scheduler.
 See also: